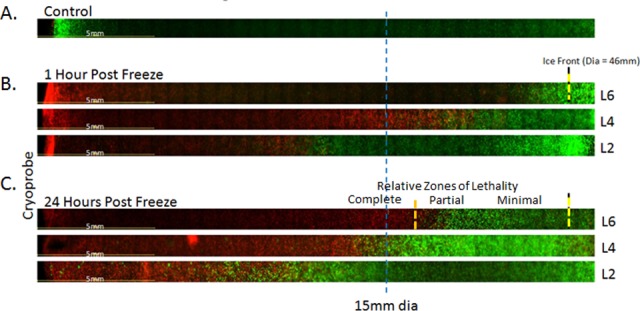
Figure 5.

Representative panoramic fluorescent images of rTEM (renal cancer) layers at 1 and 24 hours following freezing. TEMs were frozen under a 10/5/10 minute freeze/thaw/freeze protocol using a 2.4-mm V-Probe set with a 4-cm freeze length. Following freezing, individual TEM layers were dissembled and placed into culture for assessment in comparison with controls (A). Following 1 (B) and 24 (C) hours of recovery replicate TEM layers were probed with calcein-AM (green) and propidium iodide (red) and visualized using fluorescence microscopy to determine the extent of cell death. Cryoprobe was located at the left of the images. The blue line marks a 1.5-cm radial distance from the probe. The yellow dashed line indicated the edge of the iceball following the second freeze. The orange dashed line represents the approximate location of the −20°C isotherm, indicating the transition from partial to complete cell lethality. Layer 2 (L2) was at 0.5 cm up from the cryoprobe tip, L6 1/4 up (1.25 cm), and L6 at the midpoint (2 cm) of the cryoprobe freeze zone. Analysis of cell death at 24 hours postfreeze revealed an average lethal zone equivalent to 37% of the frozen mass.
