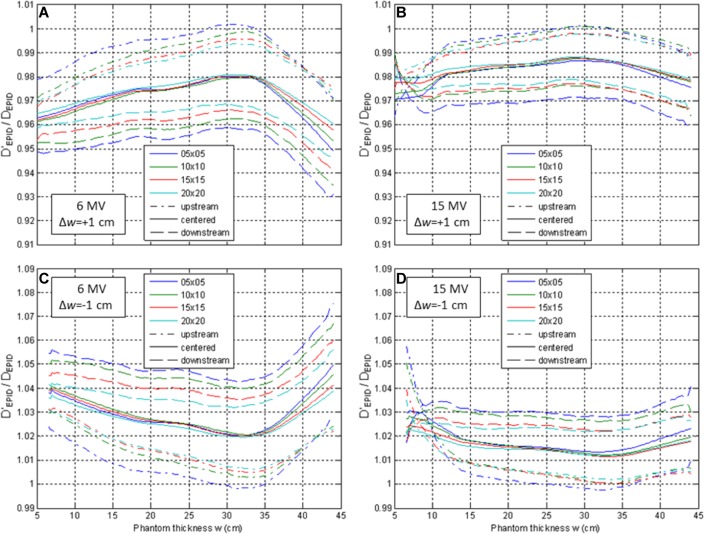
Figure 12.
Ratio of dose calculated using incorrect thickness (w) to dose calculated with correct thickness (w ± ▵w), from transit images of phantoms of thickness w ± ▵w. In the case of tissue gain/swelling (▵w = +1, A and B), use of planning CT thickness (w) causes dose underestimation. The dose calculation error is largest for thickness changes downstream of the isocenter (dashed) and is larger for 6 MV (A and C) than 15 MV (B and D).

