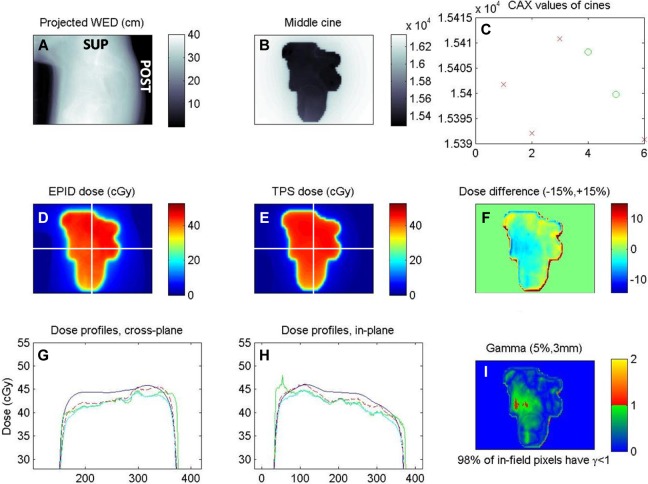
Figure 6.
Screenshot of in vivo EPID dose calculation (prone cervical cancer patient, lateral field). A, Beam’s eye view of water equivalent depth, obtained by the projection of planning CT along ray lines from source to each EPID pixel. B, One of the in vivo cine EPID images (a.u.). C, Value of the central pixels for each of the 5 cines (x-axis); the first 3 discarded due to beam-on artifacts. D, EPID–reconstructed inpatient dose at isocenter depth. E, Planned dose. F, In-field pixel-by-pixel dose difference map. G and H, Cross-plane and in-plane central profiles of planned dose (blue), dose reconstruction steps (green and cyan), and final EPID dose (dashed red). I, Gamma evaluation, 5%/3mm. Unlabeled axes are pixel number.

