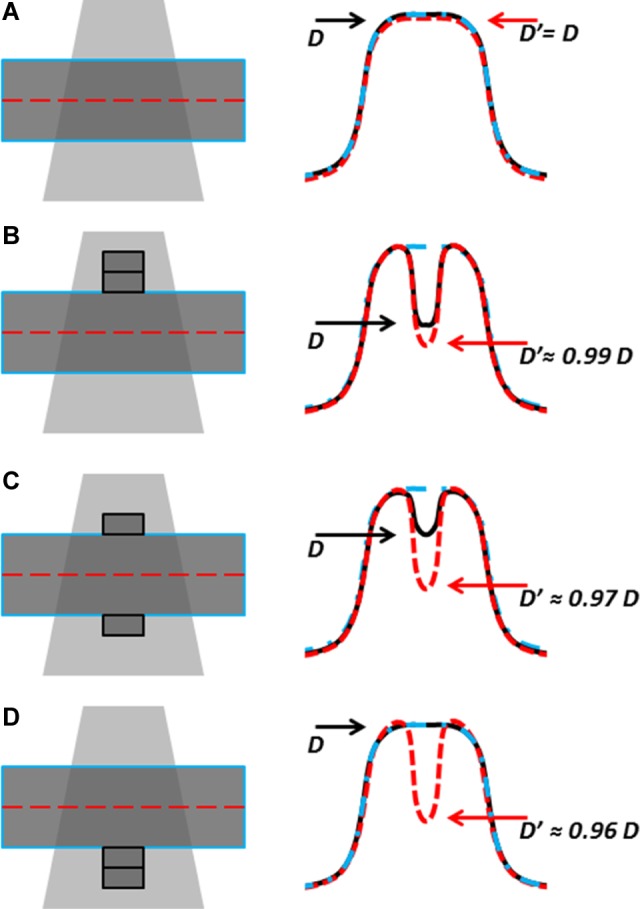
Figure 7.

Dose discrepancies flag changes in, eg, patient set up but dose values may be inaccurate. A, Treatment matches planning CT; EPID-calculated dose D′ (red dashed) and true dose D (black) agree with CT-planned dose (blue dash-dot). B, When Δw = +1 cm is introduced upstream of isocenter in the treatment but not in the CT, D′ slightly exaggerates the dose difference. C, If the extra attenuator is distributed vertically, the true dose is closer to planned dose, but the EPID signal is unchanged with respect to (B), and D′ further overestimates dose difference. D, If extra attenuator is downstream, D agrees with planned dose, while D′ underestimates dose by 4% per cm (see Figure 12A for exact values).
