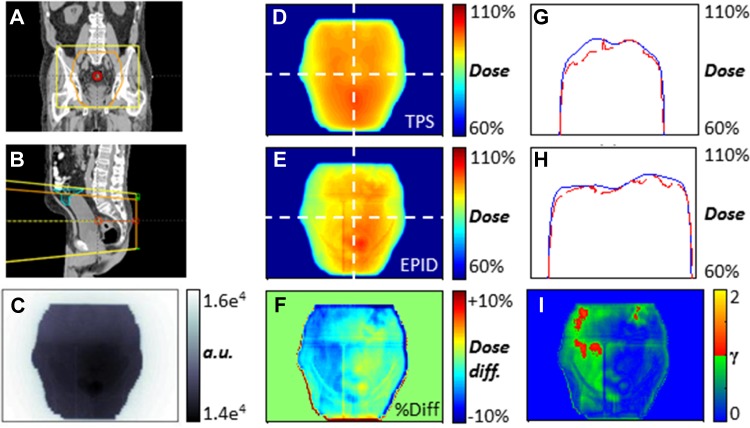
Figure 1.
Example of in vivo electronic portal imaging device (EPID) dose calculation at isocenter depth (patient 1, postero-anterior [PA] field, fraction 2). A and B, Coronal, sagittal views of planning CT and field with the small bowel contoured in cyan. C, Single cine frame. D, Planned dose map. E, EPID-reconstructed dose at isocenter depth. F, Point-to-point dose difference map. G and H, Cross-plane and in-plane dose profiles (blue, planned; dashed red, EPID) as overlaid on D and E. I, 5%, 3 mm gamma evaluation.

