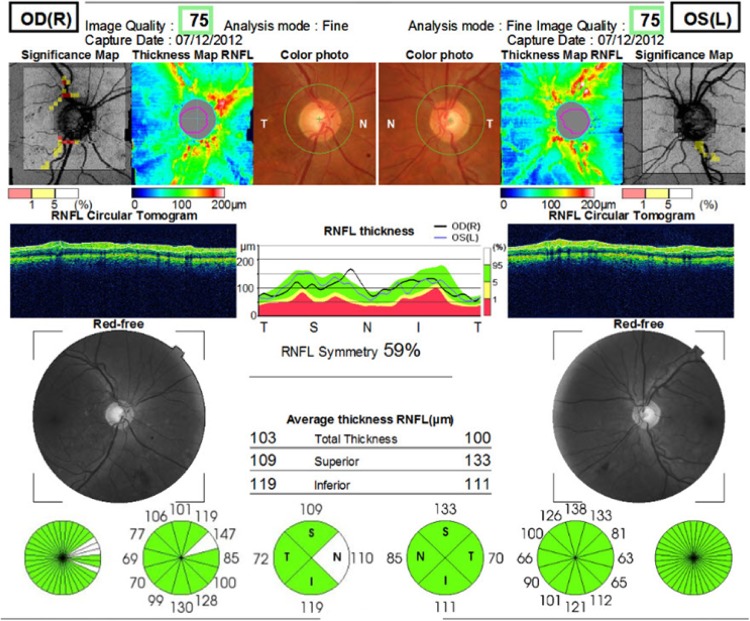
Figure 1.
Typical optical coherence tomography (OCT) report (patient number 2, a 49-year-old male). The upper image illustrates the significance and thickness maps of retinal nerve fiber layer (RNFL) and color photos for the right oculus dexter (OD) and left oculus sinister (OS) eye, respectively. RNFL thickness is plotted with respect to a circumferential retinal map on the temporal-superior-nasal-inferior-temporal (TSNIT) quadrants (middle image). RNFL analysis demonstrating measurements within normative limits in both eyes, designated by a “stoplight” designation (bottom image). Note the quadrant and clockface sector measures of RNFL thickness.

