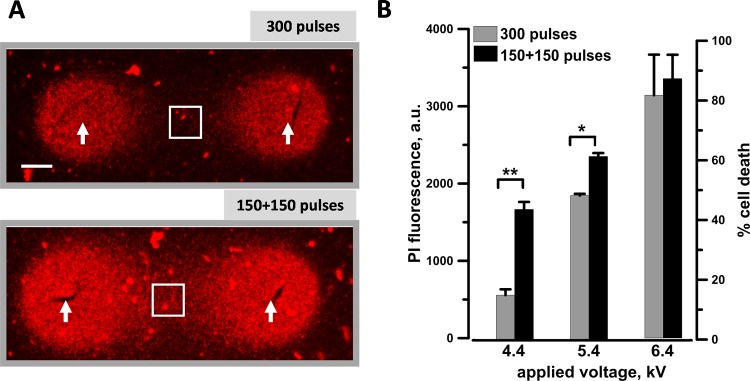
Figure 4.
Electrosensitization efficiency at different applied voltages when using a pulsed electric field (PEF)–delivering probe with 6.5 mm gap between the electrodes. KLN 205 cells seeded in 1% agarose were exposed to either a single train of 300 pulses (300 ns, 20 Hz) or 2 trains of 150 pulses each with a 2-minute interval. The pulse amplitude was varied from 4.4 to 6.4 kV. A, Each sample at 4.4 kV, a representative propidium (Pr) fluorescence image. The arrows identify the nanosecond pulsed electric field (nsPEF) delivering electrodes. Scale bar: 1 mm. The quantification in (B) shows the Pr uptake (left Y-axis) and the percentage of cell death (right Y-axis) measured within the region of interest (white square) shown in (A). Mean ± standard error (SE), n = 5 to 6. *P < .01 and **P < .001.

