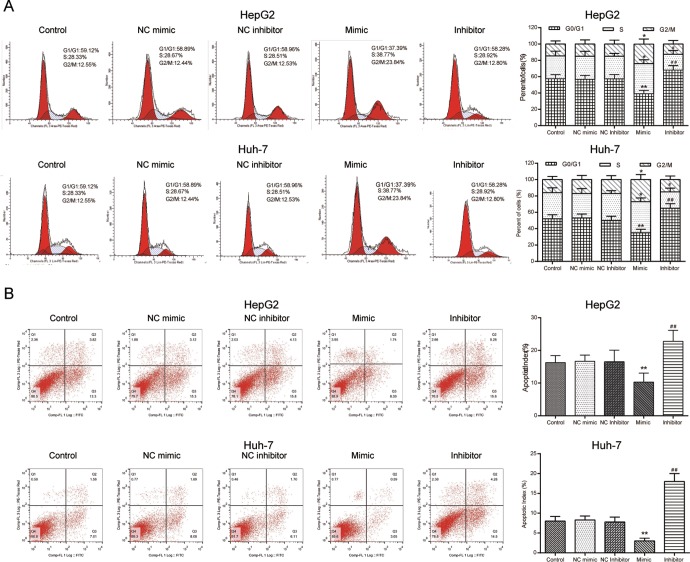
Figure 3.
The effects of miR-452-3p on HCC cell cycle and apoptosis. A, Cell cycle distribution was measured by PI staining and flow cytometry. *P < .05 vs NC mimic; **P < .01 vs NC mimic; # P < .05 vs NC mimic; ## P < .01 vs NC inhibitor. B, The apoptosis of HepG2 and Huh-7 cells was measured by Annexin V staining and flow cytometry. *P < .05 vs NC mimic; **P < .01 vs NC mimic; # P < .05 vs NC mimic; ## P < .01 vs NC inhibitor. HCC indicates hepatocellular carcinoma; NC, negative control.

