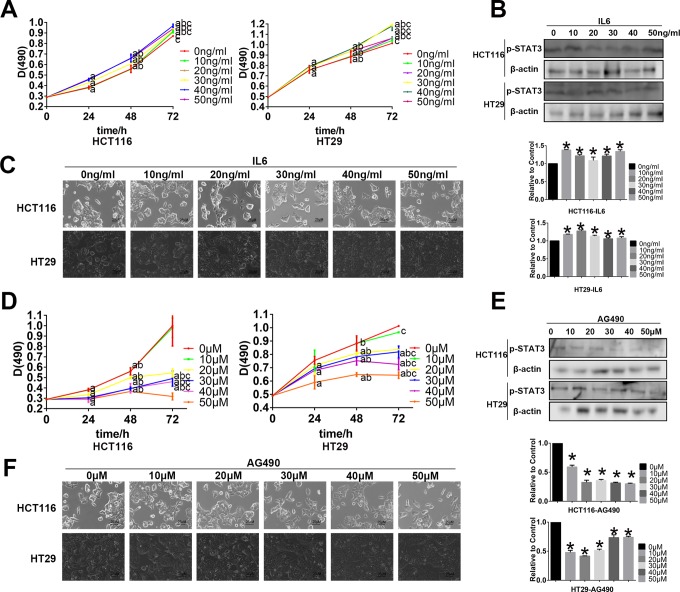
Figure 2.
Western blot assay, MTT assay, and cellular morphology to find best diluted concentration of interleukin 6 (IL-6) and AG490. A, The MTT assay shows the cell proliferation with the different diluted concentration of IL-6 treated on HCT116 and HT29 for 24, 48, and 72 hours (a P < .05, compared with the control group at the same time; bcompared with the same concentration at 24 hours; ccompared with the same concentration at 48 hours). B, The Western blot assay shows the change in p-STAT3 activation with the different diluted concentrations of IL-6 treated on HCT116 and HT29 for 48 hours. C, The cellular morphology of different dilution of IL-6 treated on HCT116 and HT29 for 48 hours (magnification, ×400). D, The MTT assay show the cell proliferation with the different diluted concentration of AG490 treated on HCT116 and HT29 for 24, 48, and 72 hours.(a P < .05, compared with the control group at the same time; bcompared with the same concentration at 24 hours; ccompared with the same concentration at 48 hours). E, The Western blot assay show the change in p-STAT3 activation with the different diluted concentration of AG490 treated on HCT116 and HT29 for 48 hours. F, The cellular morphology of different dilutions of AG490 treated on HCT116 and HT29 for 48 hours (magnification, ×400).

