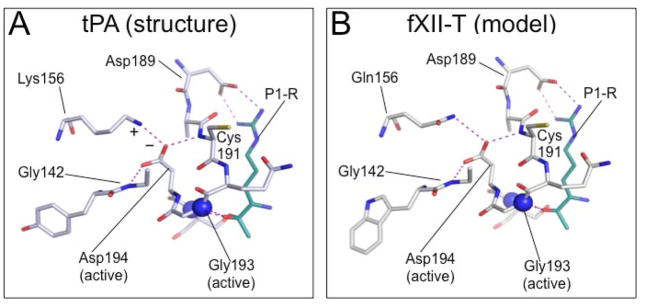
Figure 3. Model of the sc-fXII active site.
Shown are stick diagrams of S1 pocket structures with hydrogen bonds and electrostatic interactions shown as dotted lines (purple). The position of the oxyanion hole is indicated by the two blue spheres, which represent the nitrogen atoms of Ser195 and Gly193. (A) sc-tPA S1 pocket crystal structure (pdb:1BDA) showing Asp194 stabilized by a salt bridge formed with Lys156 (Indicated by + and − symbols), and by hydrogen bonds with the main-chain nitrogens of Gly142 and Cys191. The cyan stick figure represents the side-chain of the P1 arginine residue of the tPA inhibitor dansyl-Glu-Gly-Arg-chloromethyl-ketone. (B) Homology model (SWISS-MODEL [66]) of the predicted S1 pocket of fXII-T based on the sc-tPA structure. Gln156 forms a hydrogen bond with the Asp194 carboxylate group. The side-chain shown in cyan represents the P1 arginine of a substrate (PPK or fXI). Images with permission from Ivanov et al. (American Society of Hematology – Blood) [69].

