
Figure 3. Major local and long-range excitatory connections in M1.
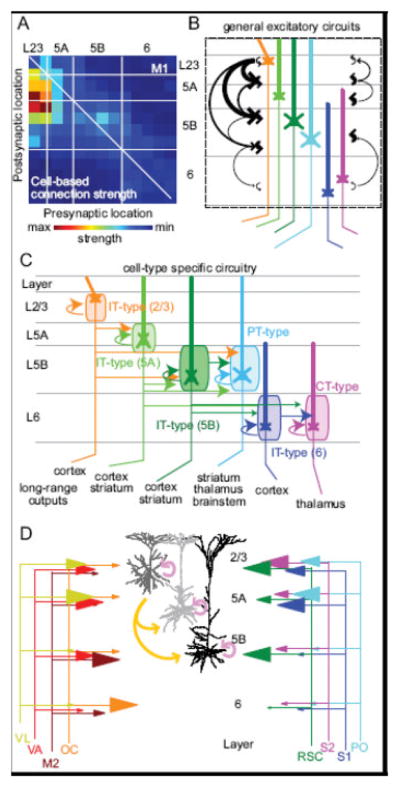
(A) Local excitatory connections between pyramidal neurons are illustrated in a connectivity matrix based on laser scanning photostimulation with glutamate uncaging (Hooks et al., 2011; Weiler et al., 2008). Presynaptic neurons are represented on the x-axis and postsynaptic pyramidal neurons are represented on the y-axis, with white lines marking rough laminar boundaries. The intense hotspot represents descending projections from L2/3 to L5A and L5B. (B) The excitatory-excitatory connectivity map is drawn as a cartoon with intralaminar and translaminar connection strength illustrated as arrow thickness. Pyramidal neurons are color-coded by projection type, matching panel (C). (C) Local circuits include substantial cell-type specificity. Pyramidal neuron cell-type is illustrated with different colors for different neurons within different layers. Cell-types send long-rang projections to specific targets (bottom). The major local projections are indicated as arrows. Orange arrows from L2/3 neurons indicate intralaminar connectivity as well as outputs to L5A and L5B neurons. IT-type neurons are subdivided into groups by layer (2/3, 5A, 5B, and 6). PT-type neurons and CT-type neurons generally receive input from other cell-types but do not send strong output back to these neurons in the local circuit. Specific connectivity of distinct neuron types is reviewed in (Shepherd, 2013). (D) L2/3, L5A, and L5B (shades of gray) illustrated in pink (intralaminar connections) and gold (translaminar connections). L6 neurons not illustrated. Long-range input from a number of thalamic and cortical projections is summarized. Sensory projections from parietal areas, including S1 (Mao et al., 2011), S2 (Suter and Shepherd, 2015), and retrosplenial cortex (RSC; Yamawaki et al., 2016), as well as sensory thalamus (Hooks et al., 2013) are shown in cool colors at right. Frontal cortex projections from secondary motor cortex (M2) and orbital cortex (OC) as well as motor thalamus (VA and VL; Hooks et al., 2013) are shown in hot colors at left. Size of arrowheads is proportional to amplitude of excitatory inputs to pyramidal neurons.