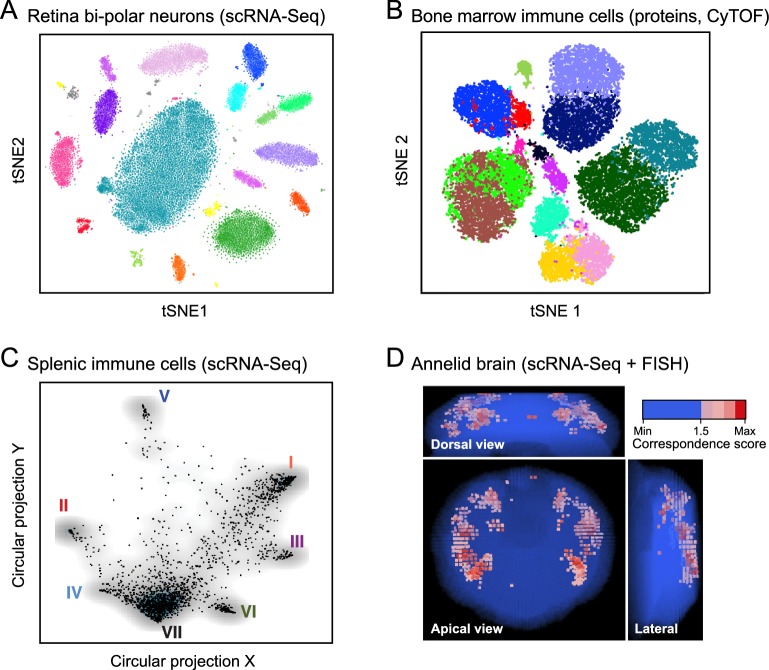
Figure 2. Anatomy: cell types and tissue structure.
The first three plots show single cells (dots) embedded in low-dimensional space based on similarities between their RNA-expression profiles (A, C) or protein-expression profiles (B), using either t-stochastic neighborhood embedding (A,B) or circular projection (C) for dimensionality reduction and embedding. (A) Bi-polar neurons from the mouse retina. (B) Human bone marrow immune cells. (C) Immune cells from the mouse spleen. (D) Histology. Projection of single-cell data onto tissue structures: image shows the mapping of individual cells onto locations in the marine annelid brain, based on the correspondence (color bar) between their single-cell expression profiles and independent FISH assays for a set of landmark transcripts.
© 2016 Elsevier Inc.
Figure 2A reprinted from Shekhar et al., 2016 with permission.
© 2015 Elsevier Inc.
Figure 2B reprinted from Levine et al., 2015 with permission.
© 2014 AAAS.
Figure 2C reprinted from Jaitin et al., 2014 with permission.
© 2015 Macmillan Publishers Limited.
Figure 2D adapted from Achim et al., 2015 with permission.

