. 2017 Dec 27;6:e32537. doi: 10.7554/eLife.32537

Figure 1. Estimating intron-specific splicing half-lives.

(A) Progressive labeling with 4sU results in sampling of nascent RNA molecules from polymerase molecules distributed across a gene (bottom). The probability of sampling reads from unspliced or spliced transcripts, represented by intron-exon (pink) and exon-exon (blue) junction reads respectively, is dependent on the intron half-life and the location of the polymerase at the completion of the labeling period (top). (B) Schematics outlining the three approaches assessed for measuring rates of intron excision. (C) Mean Spearman correlations between simulated half-lives and estimated splicing rates from each of our three approaches (error bars are ± standard error). (D) Absolute percent error of our estimated splicing rates relative to simulated half-lives. Intron ratios are relative measures of half-lives, thus were not included in this comparison (error bars are ± standard error). (E) Relative absolute percent error of the estimated and simulated half-lives between two introns, allowing comparisons of metrics not expected to be drawn from the same distribution (error bars are ± standard error). (F) Estimated half-lives from Ψ decrease and junction dyanmics approaches (x-axis) versus to the half-lives used to simulate read data (y-axis). Yellow line indicates y = x line of perfect correlation. (G and H) Nascent RNA coverage across the second intron of Srp68 (G) and the first intron of Rab1 (H). Colors represent time points, with 5 min after 4sU labeling (darkest shade), through 10 min, 20 min, and total RNA sample (lightest shade). Right panels show the proportions of intron-exon (pink) and exon-exon (blue) junction reads out of all 3’ junction reads in each labeling period.

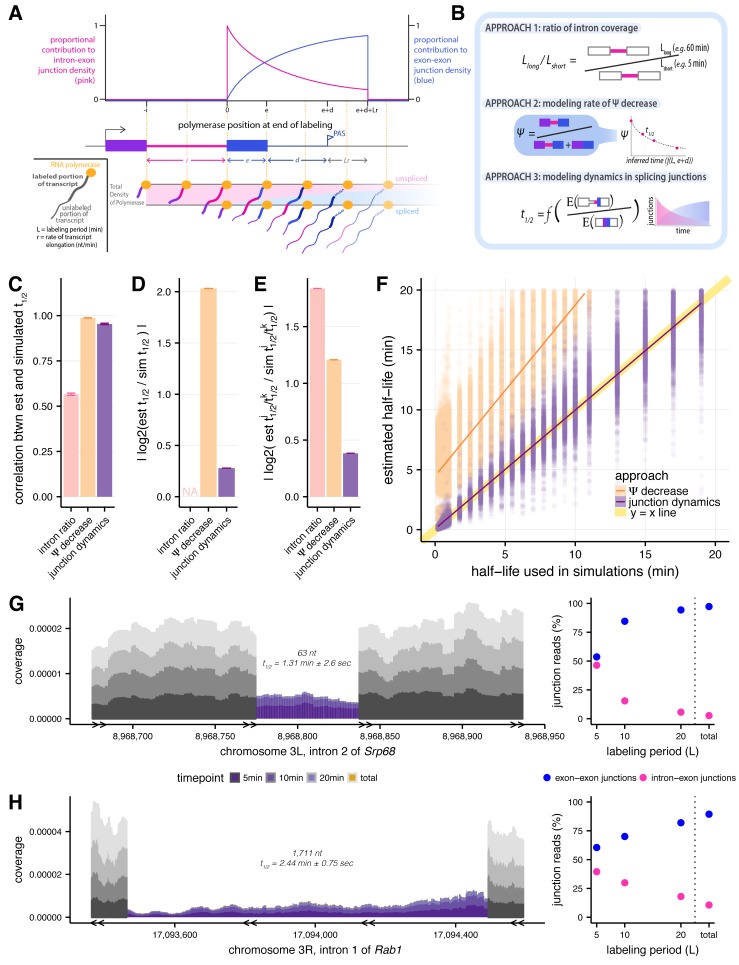
Figure 1.

Figure 1—figure supplement 1. Simulating 4sU-seq reads.

Figure 1—figure supplement 1.

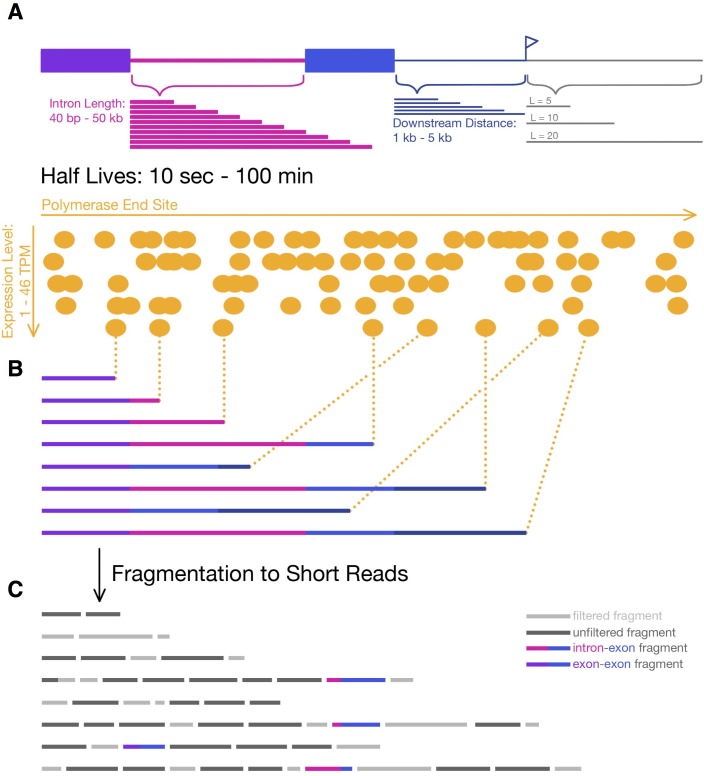
(A) Parameters over which 4sU-seq reads where simulated, including intron length (pink; 40 nt – 50 kb), distance downstream of 3’ splice site (dark blue; 1–5 kb), labeling period (grey; 5, 10, 20, and 60 min), expression levels (orange; 1–46 TPM), and half-lives (0.2–100 min). (B) Transcripts are selected from a uniform distribution of polymerase end sites (determined by the progression of transcription within a labeling period) and a probability of splicing (dependent on the half-life). (C) Transcripts are fragmented, all fragments between [200-300] nt are retained (dark grey; simulating the size-selection step in library preparation), and the first 50 nt of each fragment is considered a read. For the junction dynamics approach, only intron-exon (pink-blue) and exon-exon (purple-blue) reads are used.

Figure 1—figure supplement 2. Assessing approaches for estimating intron-specific splicing half-lives.

Figure 1—figure supplement 2.

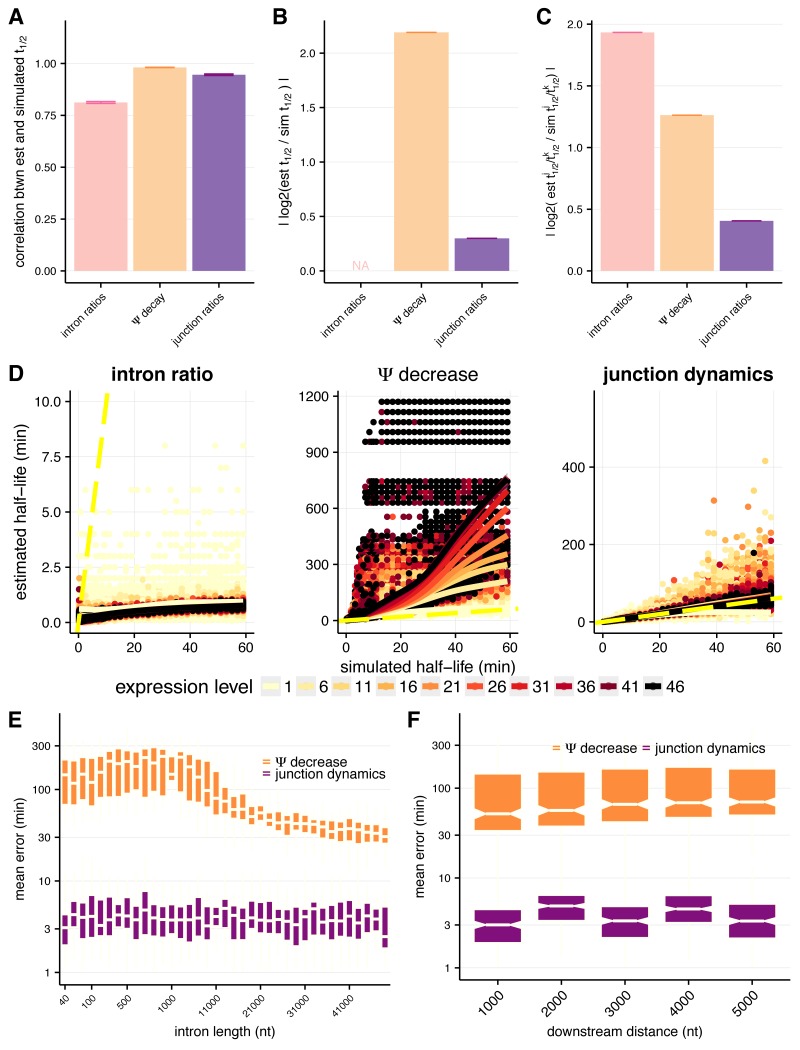
(A) Mean Spearman correlations between simulated half-lives and estimated splicing rates from each of our three approaches for the full distribution of simulated half-lives (0.2–100 min). Error bars are ± standard error. (B) Absolute percent error of our estimated splicing rates relative to simulated half-lives for the full distribution of simulated half-lives (0.2–100 min). Intron ratios are relative measures of half-lives, thus were not included in this comparison (error bars are ± standard error). (C) Relative absolute percent error of the estimated and simulated half-lives between two introns for the full distribution of simulated half-lives (0.2–100 min), allowing comparisons of metrics not expected to be drawn from the same distribution (error bars are ± standard error). (D) Estimated half-lives (x-axis) relative to the half-lives used to simulate read data (y-axis) for each approach to estimate splicing rates. Colors indicate introns sampled from different expression levels (in TPM) and dotted yellow line represents the y = x line. (E) Mean error across the range of simulated half-lives (y-axis) for our estimated splicing rates relative to simulated half-lives across the range of simulated intron lengths (x-axis) for the Ψ decrease and junction dynamics approaches (orange and purple, respectively). (F) Mean error across the range of simulated half-lives (y-axis) for our estimated splicing rates relative to simulated half-lives across the range of distances downstream of the 3’ splice site (x-axis, representative of 3’ transcript length) for the Ψ decrease and junction ratio approaches (orange and purple, respectively).

Figure 1—figure supplement 3. Applying the junction dynamics approach to estimate intron-specific half-lives in Drosophila cells.

Figure 1—figure supplement 3.

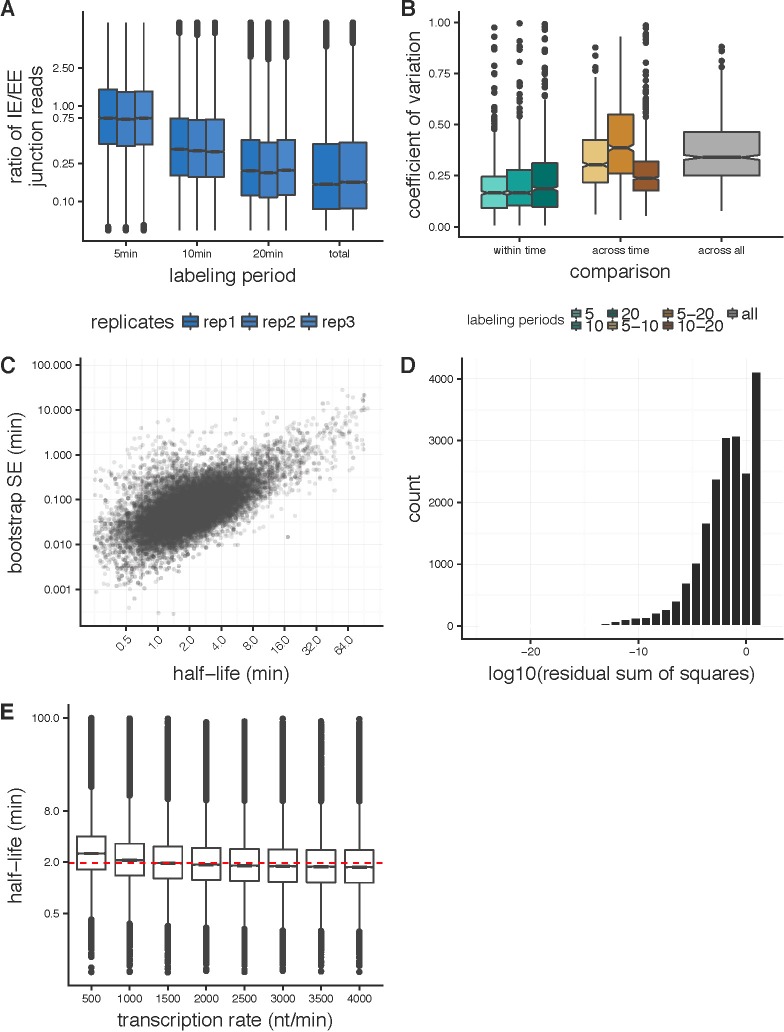
(A) Ratio of intron-exon (IE) to exon-exon (EE) junction reads for an intron (y-axis) for nascent RNA collected 5 min, 10 min, and 20 min after 4sU labeling, with a time point labeled overnight representing steady-state or total RNA levels. The overall decrease in IE/EE ratios with increasing labeling periods indicates increased completed splicing over time. (B) For the 1000 highest expressed introns in Drosophila S2 cells, the coefficient of variation between splicing half-lives for half-lives calculated across replicates within labeling period (shades of green), across pair-wise sets of labeling periods (shades of orange) and across all replicate and labeling periods (grey). (C) Standard error estimates on half-lives (y-axis) calculated from bootstrapping across sub-sampled read populations (see Materials and methods) across a range of splicing half-lives (x-axis). (D) Distribution of the residual sum of squares (log10, x-axis) assessing the goodness-of-fit for the junction dynamics model across the three labeling periods. (E) Distributions of splicing half-lives (y-axis) estimated using the junction dynamics approach across a range of constant transcription rates (x-axis) input in the model, which are consistent with the range of transcription rates that have been observed previously.