. 2017 Dec 27;6:e32537. doi: 10.7554/eLife.32537

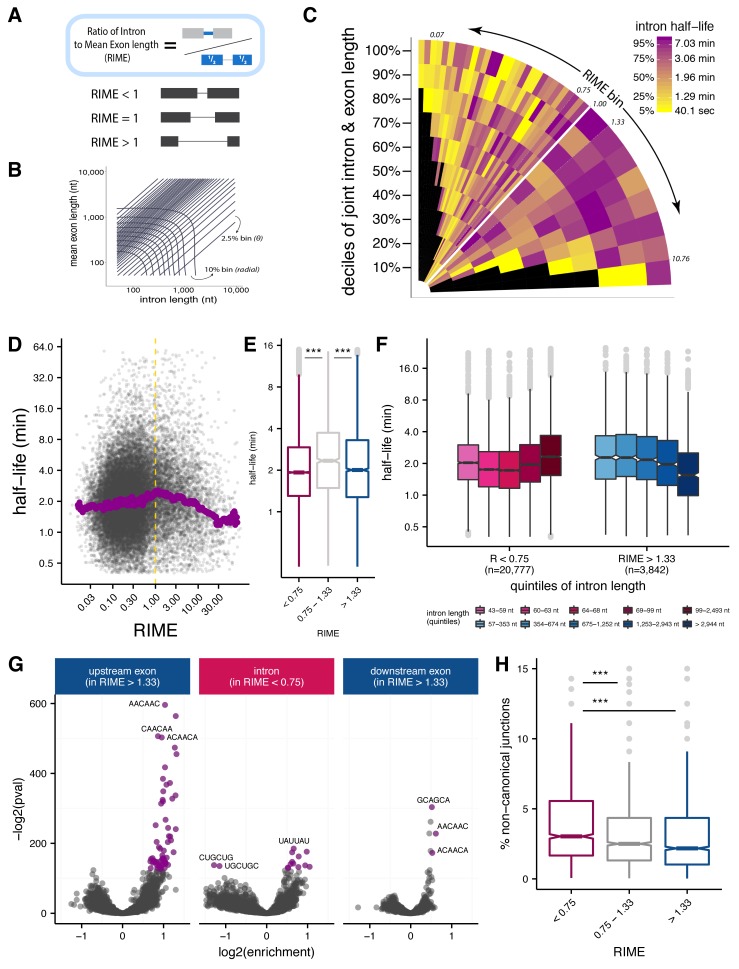
Figure 3. Splice site recognition mode influences the efficiency of splicing.

(A) The Ratio of Intron to Mean Exon (RIME) metric is defined as the ratio of a given intron length to the mean length of the exons flanking that intron. (B) Schematic of binning to capture intron length (x-axis, nt), mean flanking exon length (y-axis, nt), and RIME values in a single plot. Radial bins capture both intron and and mean exon length (10% bins), while diagonal bins (2.5% bins, θ axis) capture the RIME distribution. (C) Distribution of mean splicing half-lives across bins of RIME (θ axis) and deciles of joint intron and exon lengths (r axis). Yellow represents short mean half-lives and dark purple represents longer mean half-lives. (D) Running median of splicing half-lives across distribution of RIME values. Median is computed in sliding bins of 200 introns. (E) Distribution of splicing half-lives for introns with RIME <0.75 (pink), 0.75 < RIME < 1.33 (grey), and RIME >1.33 (blue). (F) Splicing half-lives across quintiles of intron length in each RIME class (RIME <0.75 in shades of pink on left and RIME >1.33 in shades of blue on right). (G) Enrichment of 6mers in exons upstream of introns with RIME >1.33 (left), intronic regions of introns with RIME <0.75 (middle), and exon downstream of introns with RIME >1.33 (right). Significant 6mers are in purple (Benjamini-Hochberg corrected p-value<10−30). (H) Splicing accuracy measured by percentage of non-canonical unannotated reads for introns with RIME <0.75 (pink), 0.75 < RIME < 1.33 (grey), and RIME >1.33 (blue).

Figure 3.

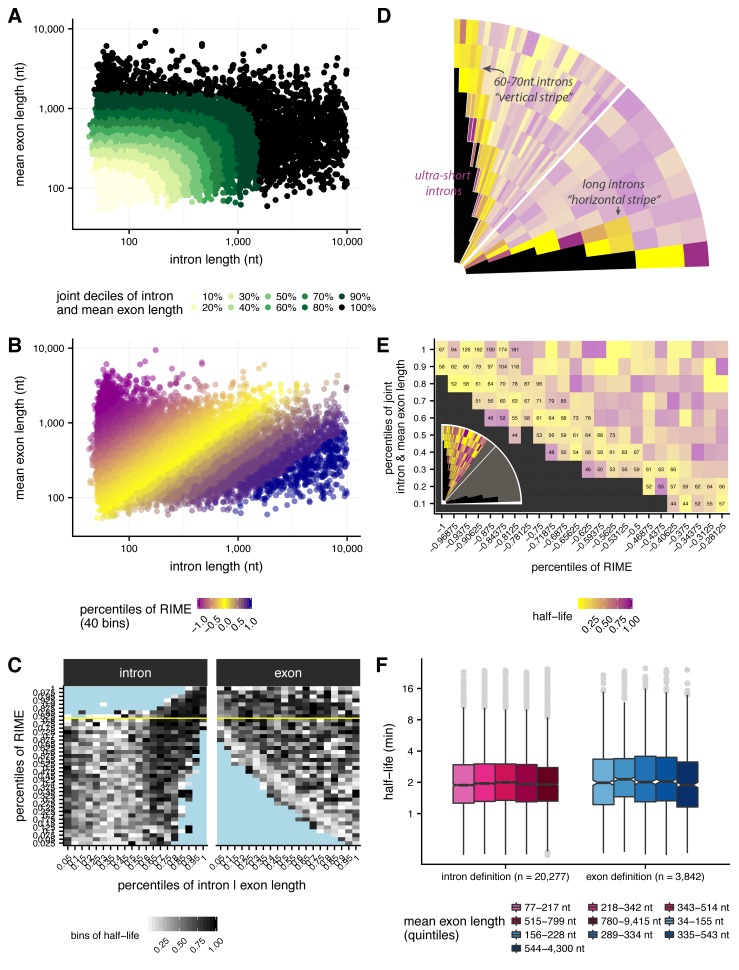
Figure 3—figure supplement 1. Jointly evaluating effects of intron and exon length on splicing half-lives.

Figure 3—figure supplement 1.

(A) Deciles of joint intron and mean exon length (x-axis and y-axis, respectively) shown across shades of green. Deciles are taken across the distribution of each intron’s length distance from [0 nt,0 nt]. (B): RIME values in 40 bins with 2.5% percent of the total number of introns in each bin. Bins are initiated at RIME = 1 (~80 percentile), with 32 bins in the RIME < 1 regime and eight bins in the RIME > 1 regime. (C) Intron length (left, nt) and exon length (right, nt) versus RIME values (2.5% bins, y-axis), broken into 5% length bins and shading indicates half-life. Bins filled with blue indicate no data and yellow line represents RIME = 1. (D) Highlighting stripes of ultra-short introns (purple, left stripe), short introns 60-70 nt (yellow vertical stripe), and long introns (yellow horizontal stipe). (D) Mean intron length (numbers) for a subset of bins of joint intron and mean exon length and RIME value, as indicated in the inset (grey bins are not shown, outlined bins have mean intron lengths shown). Colors indicate splicing half-life. (E) Splicing half lives across quintiles of exon length in each RIME class (RIME < 0.75 in shades of pink on left and RIME > 1.33 in shades of blue on right).
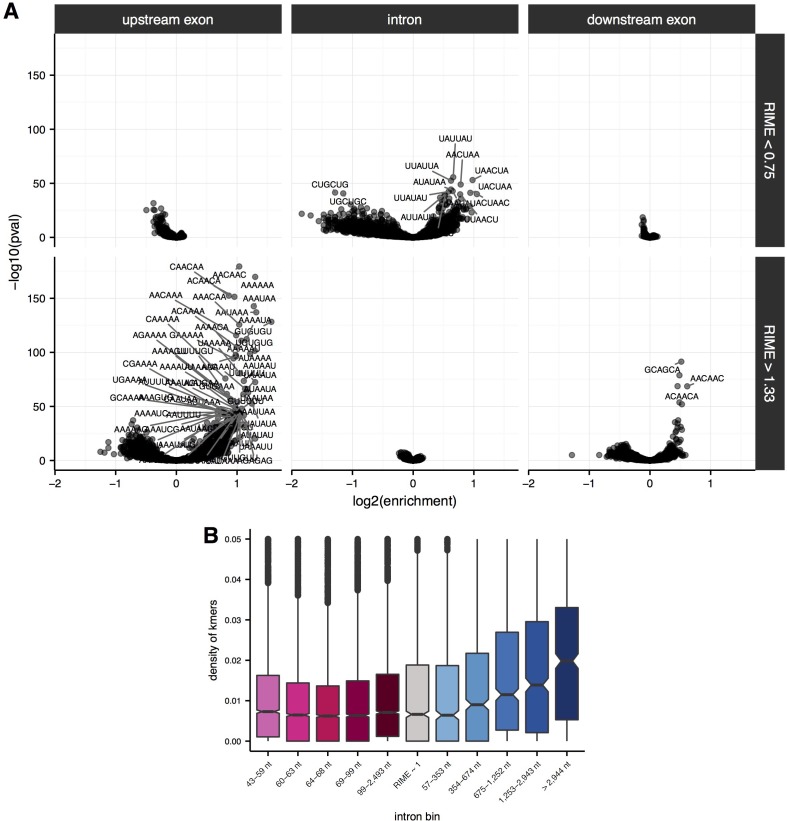
Figure 3—figure supplement 2. Enrichment of sequence elements in and around introns with variable RIME values and lengths.

Figure 3—figure supplement 2.

(A) Enrichment of 6mers in flanking upstream exons (left), intronic regions (middle) and flanking downstream exons (right) for introns with RIME < 0.75 (top) and RIME > 1.33 (bottom). 6mer sequences are indicated for significant 6mers (Benjamini-Hochberg corrected p-value<10−30). (B) Density of significant 6mers (number of kmers/length of region; y-axis) for each quintile of intron length for introns with RIME < 0.75 (shades of pink), RIME > 1.33 (shades of blue) and 0.75 < RIME < 1.33 (grey).