. 2017 Dec 27;6:e32537. doi: 10.7554/eLife.32537

Figure 4. Splicing efficiency across introns within a gene.

(A) Relative importance of variables influencing variance in splicing half-lives in intron-defined (left) and exon-defined (right) introns, using a multiple linear-regression to account for variance in half-lives for non-first introns. (B) Mean variance of splicing half-lives across introns within a gene relative to randomly sampled introns (chosen to match the distribution of lengths within actual genes; error bars are ± standard error). (C) Average standard deviation of intron lengths across introns within a gene relative to randomly sampled introns (error bars are ± standard error). (D) Average standard deviation of splicing half-lives across introns within genes with mostly intron-defined introns (left), mostly exon-defined defined introns (right), and a mixture of definition classes (middle), relative to randomly sampled introns within each category of genes (lighter colors). (E) Enrichment of genes (x-axis; log2) within Gene Ontology categories that are significantly over-represented among exon-defined genes (y-axis) for classes of genes with increasing proportions of exon-defined genes: all intron-defined (pink), mixed-definition (grey), and exon-defined (blue).

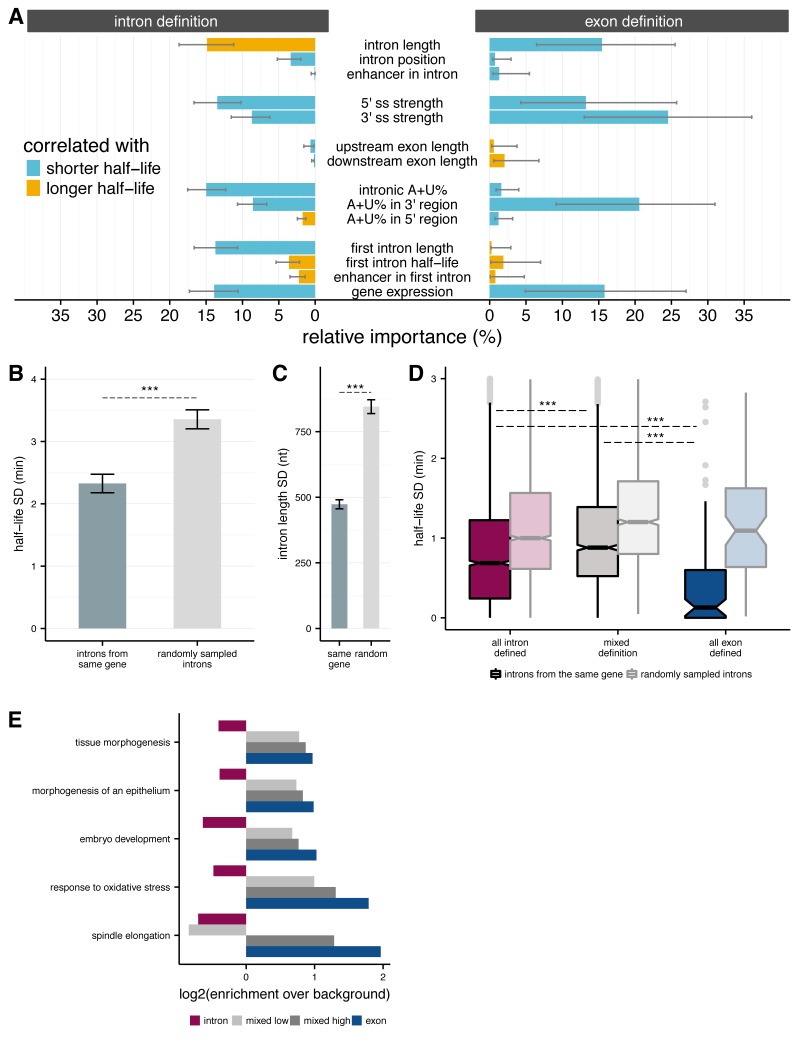
Figure 4.

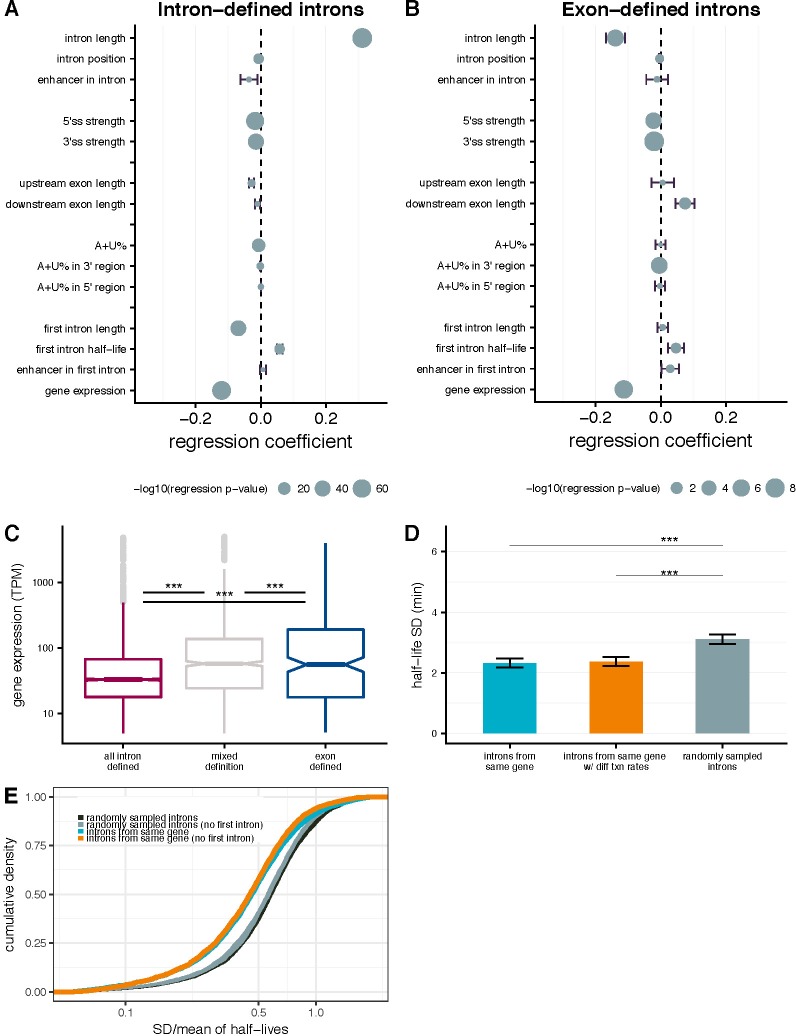
Figure 4—figure supplement 1. Intron- and gene-specific variables contributing to variability in splicing half-lives.

Figure 4—figure supplement 1.

Coefficients from a multiple linear-regression with several parameters (y-axis), where the coefficient represents the % change in half-life concordant with a 1% change in each parameter for intron-defined (A) and exon-defined (B) introns. Bars indicate the standard error and the size of the mean dot indicates the –log10 p-value for the significance of the individual parameter. (C) Distribution of gene expression (TPM; y-axis) for genes with have introns that are mostly intron-defined (pink), mostly exon-defined (blue) or have mixed definition of their introns (grey). (D) Mean variance of splicing half-lives across introns within a gene (left) relative to splicing half-lives calculate using random transcription rates (between 0.5 and 5 kb/min) across introns with a gene (middle) and randomly sampled introns (right, chosen to match the distribution of lengths within actual genes; error bars are ± standard error). (E) The cumulative distribution of variance in splicing half-lives (coefficient of variation; x-axis) across introns within a gene (blue) and introns randomly sampled to match the distribution of length so fintrons within actual genes (black). This trend is consistent when excluding the first intron of each gene (orange) and doing a similar sampling strategy excluding selection of first introns (grey).
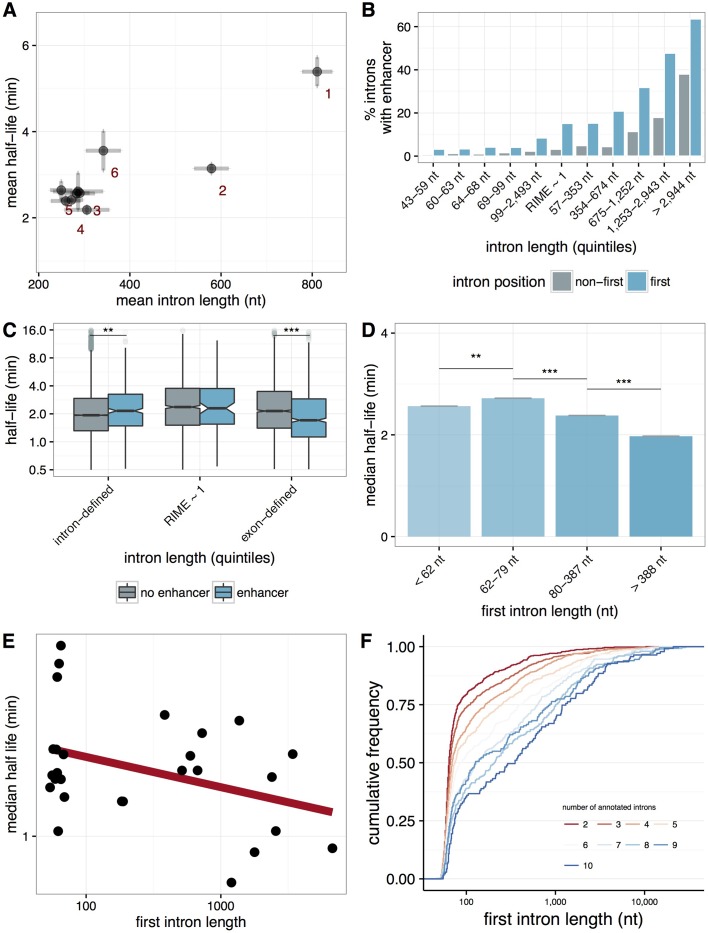
Figure 4—figure supplement 2. First-intron length and splicing efficiency.

Figure 4—figure supplement 2.

(A) The distribution of splicing efficiency (median half-lives, y-axis) vs. intron length (mean nucleotides, x-axis) for introns in different positions across a gene. First introns are longer and more slowly spliced than non-first introns. (B) The percentage of enhancers within an intron (y-axis) for first introns (blue) and non-first introns (grey) binned by quintiles of intron length (x-axis). (C) The distribution of intron half-lives (y-axis) for introns containing an enhancer (blue) and without an enhancer (grey) binned by quintiles of intron length (x-axis). (D) Median splicing half-lives of non-first introns (mean within a bin; y-axis) within a gene for quantiles of first intron lengths (x-axis), with standard errors across the mean. (E) Selected genes with five or more total introns, of which all of the non-first introns are 60-70 nt in length and have low variance across their splicing half-lives. Varying first intron lengths across these genes (nt, x-axis) shows a correlation between first intron length and the median half-lives for these genes (y-axis). (F) Cumulative distributions of first-intron lengths (x-axis) for groups of genes classified by number of annotated introns (colors).