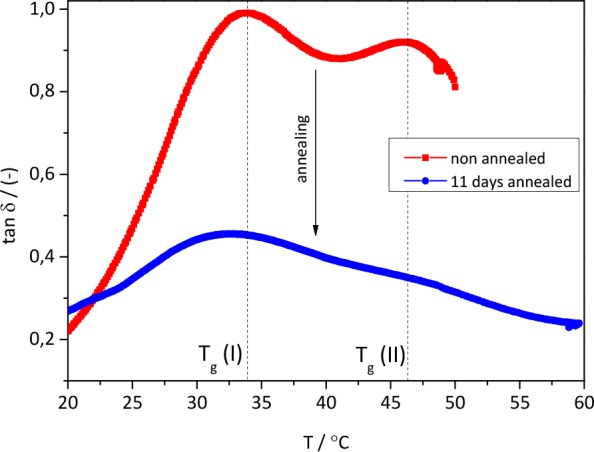
Figure 7.

Rheological T-sweep curves. Effect of annealing on the glass transition relaxation behavior of the BPDA-D polymer. Red curve represents the nonannealed polymer and the blue curve shows the polymer annealed for 11 days at Tann = T(tan δMAX) = Tg.
