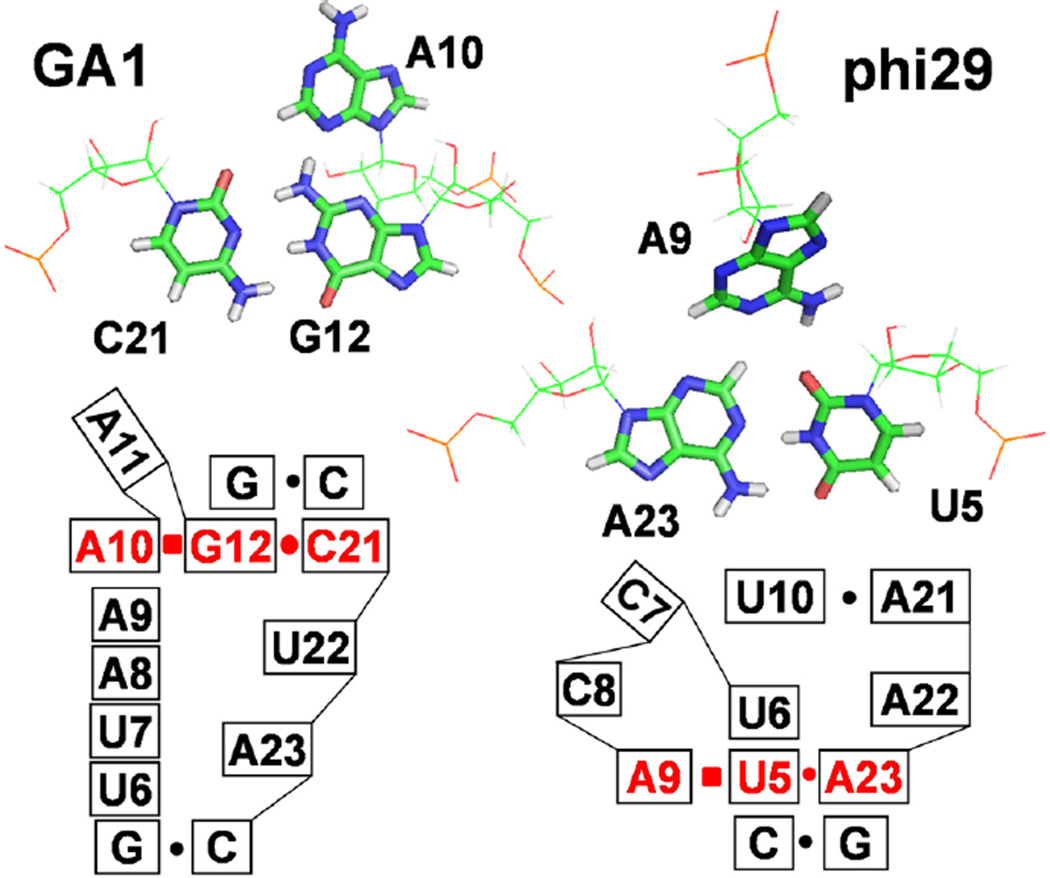
Figure 3.
Base triples in GA1 and phi29 pRNA loops.46 In the lower secondary structure models, lines represent the phosphodiester backbone between nucleotides. Stacked boxes indicate base stacking. The solid circles and squares represent cis-Watson–Crick and cis-Hoogsteen pairing.47 NOEs A10H2–C21H1′, A10H2–G13H1′, and A10H8–G12H1′ indicate base triple formation (Figure S1).

