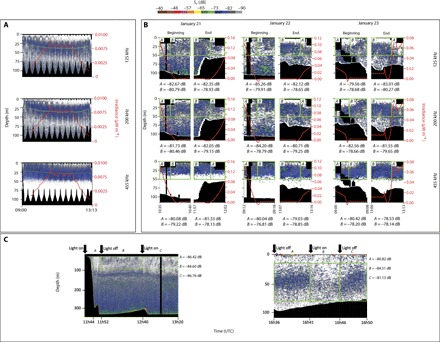
Fig. 2. Volume backscattering (Sv) echograms.

(A) Acoustic Zooplankton Fish Profiler (AZFP; ASL Environmental Science Inc.) echograms at 125 (dominated by euphausiids), 200 (dominated by chaetognaths), and 455 kHz (dominated by copepods) on 23 January. The red line (and second y axis) indicates the irradiance (μW m−2) when away from the ship. The green line indicates the median depth of the SSL at each frequency. Note that a time-varied threshold of −122 dB was applied at 455 kHz. (B) AZFP echograms at 125, 200, and 455 kHz at the beginning and at the end of each survey. The red line indicates the irradiance, and the green boxes indicate acoustic backscatter data collected in the top 50 m (A) close to the ship and (B) away from the ship. Mean Sv within each box is indicated below the echograms. (C) Responses of zooplankton to ambient versus artificial light. The RV Helmer Hanssen EK60 echogram was recorded at 120 kHz in Kongsfjorden on 9 January 2017 (left) and the AZFP echogram at 125 kHz was recorded from a small boat in Kongsfjorden on 21 January 2017 (right). Black arrows indicate when the lights were turned off and on, and mean Sv in the green boxes (calculated in the linear form) for each period is indicated by the echograms. Note that the sequence of artificial light on/off is reversed in the left and right panels, and the SSL responds accordingly with avoidance during the “Light on” period. In all echograms, black areas mask the near-field region, noise, and areas below the seafloor.
