
Fig. 1. Time-lapse measurements of seismic velocity changes.
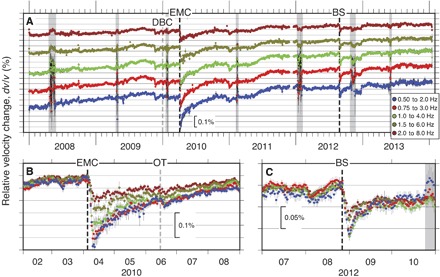
(A) Time history of seismic velocity (dv/v) with two-sigma SDs at five different frequency bands during December 2007 to January 2014. (B and C) Same as (A), but with time interval between February to August 2010 and July to October 2012. EMC, BS, DBC, and OT represent the 2010 Mw 7.2 El Mayor–Cucapah earthquake, the 2012 Brawley seismic swarm, the 30 December 2009 M 5.8 Delta, Baja California, Mexico, and the 15 June 2010 M 5.7 Ocotillo earthquake, respectively (vertical dashed lines). Gray areas indicate time windows in which we were not able to recover empirical Green’s functions (fig. S2 and Materials and Methods).