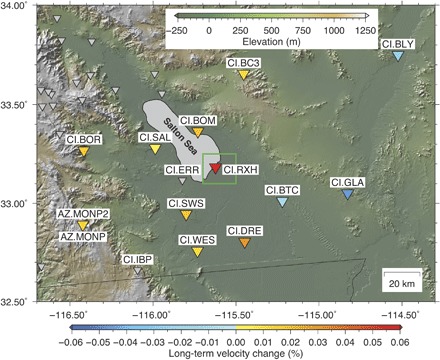
Fig. 4. Long-term linear trend of velocity change.

Values of long-term linear trend of velocity changes in a frequency range of 0.5 to 2.0 Hz obtained from curve fitting (table S1 and Materials and Methods) are shown by the color code in the bottom of the figure. Green rectangle is the SSGF region shown in fig. S1. Background color represents topography.
