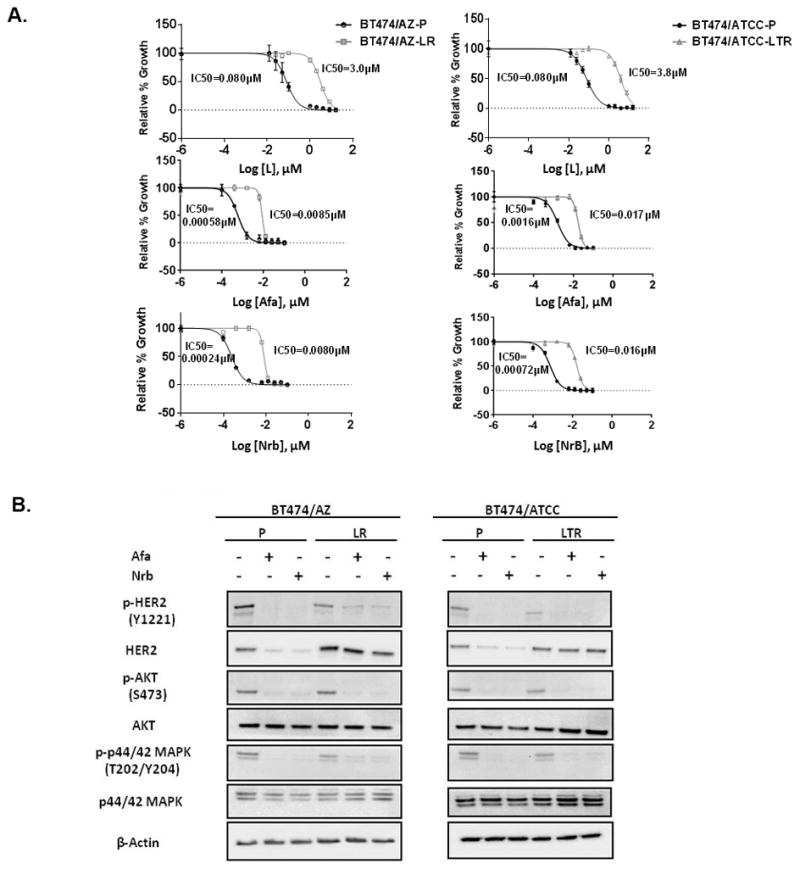
Fig. 3. The irreversible HER1/2 inhibitors overcome acquired resistance to HER2-targeted therapy conferred by the HER2L755S mutation in BT474 models in vitro.

A, Responses of BT474/AZ-LR and BT474/ATCC-LTR lines and their relative parental lines (BT474/AZ-P and BT474/ATCC-P) to lapatinib (L), afatinib (Afa), and neratinib (Nrb) were measured by cell growth assay. Data was analyzed by GraphPad Prism (version 6.05) to generate drug response curves and relative IC50 values using the Log (inhibitor) vs. response-variable slope model (Bars=SEM) with normalization of data defining the biggest number in each dataset as 100% and the smallest number in the same dataset as 0%. B, BT474/AZ-P, BT474/AZ-LR, BT474/ATCC-P, and BT474/ATCC-LTR lines were treated with or without 6h of 50nM Afa or Nrb followed by Western blot.
