
Figure 1. Artemether does not promote the transdifferentiation of alpha to beta cells but instead suppresses overall islet cell identity.
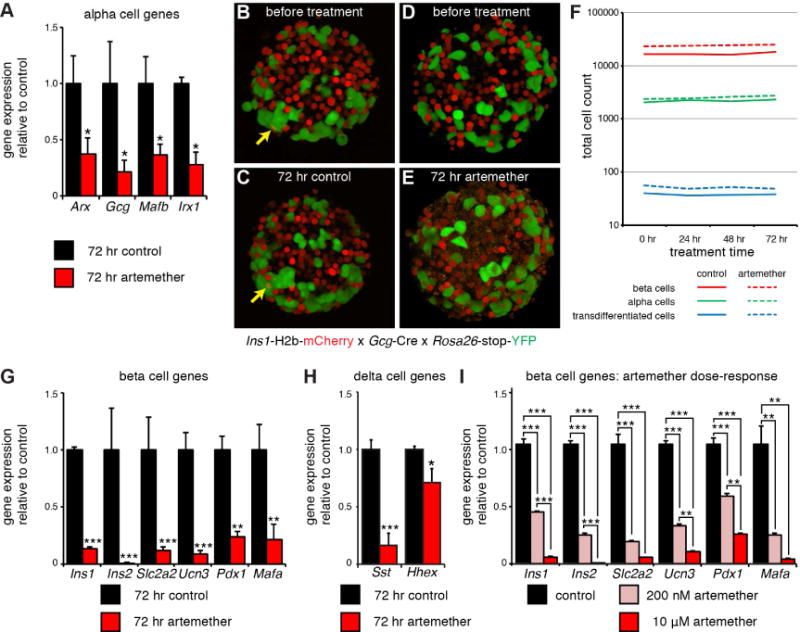
(A) Real time quantitative PCR analysis of Arx, Gcg, Mafb, and Irx gene expression in artemether treated islets (n=4 replicates). *p<0.05.
(B) 3D reconstruction of a representative image of an islet from an Ins1-H2B-mCherry x Gcg-Cre x Rosa26-stop-YFP triple transgenic reporter mouse at the onset of the experiment. Arrow indicates an mCherry/YFP co-positive cell that represents a spontaneous alpha to beta transdifferentiated cell.
(C) Islet in (B), re-imaged after 72 hr of incubation. Arrow indicates the same alpha to beta transdifferentiated cell that was present prior to the 72 hr culture window.
(D) 3D reconstruction of a representative image of another islet from the same mouse as in (B) prior to artemether treatment.
(E) Islet in (D), re-imaged after 72 hr of culture in the presence of 10 μM artemether. No alpha to beta transdifferentiated cells are present, note the appearance of a ‘speckled’ background across the entire islet. See also Movie S1.
(F) Quantification of the total number of alpha, beta and alpha to beta transdifferentiated cells. The same islets were imaged repeatedly in 3D at 24 hr intervals. n = 5 mice, 8–17 islets per animal for each treatment.
(G) Real time quantitative PCR analysis of the expression of a panel of beta cell genes in artemether treated islets (n=4 replicates). *p<0.05, **p<0.01, ***p<0.001.
(H) Real time quantitative PCR analysis of the expression of a panel of delta cell genes in artemether treated islets (n=4 replicates). *p<0.05, **p<0.01, ***p<0.001.
(I) Real time quantitative PCR analysis of a panel of beta cell genes in islets treated for 72 hr with 200 nM or 10 μM artemether (n=4 replicates). *p<0.05, **p<0.01, ***p<0.001.