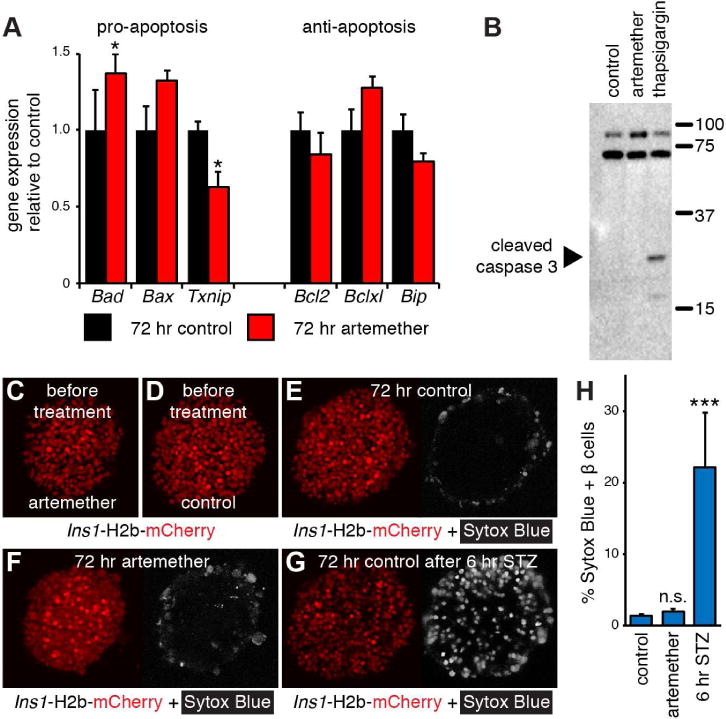
Figure 2. Artemether does not induce beta cell death.

(A) Real time quantitative PCR analysis of the expression of a panel of pro- and anti-apoptotic genes in artemether treated islets (n=4 replicates). *p<0.05.
(B) Western blot analysis of the apoptosis marker cleaved caspase 3 in islets treated for 72 hr with 10 μM artemether. Thapsigargin (750 nM) was used as a positive control.
(C) 3D reconstruction of a representative Ins1-H2b-mCherry islet before artemether treatment.
(D) 3D reconstruction of a representative Ins1-H2b-mCherry control islet before culture.
(E) Islet in (D) re-imaged after 72 hr in culture. The nuclear dead cell marker Sytox Blue was added at 72 hr.
(F) Islet in (C) re-imaged after 72 hr in culture with 10 μM artemether. The nuclear dead cell marker Sytox Blue was added at 72 hr.
(G) 3D reconstruction of the same islet as in (E) after 6 hr in the presence of STZ to induce beta cell death.
(H) Quantification of the fraction of Sytox Blue positive beta cells after 72 hr in control (12 islets), and artemether-treated cultures (16 islets) compared to control islets exposed to STZ for an additional 6 hr (5 islets). ***p<0.001 compared to control.
