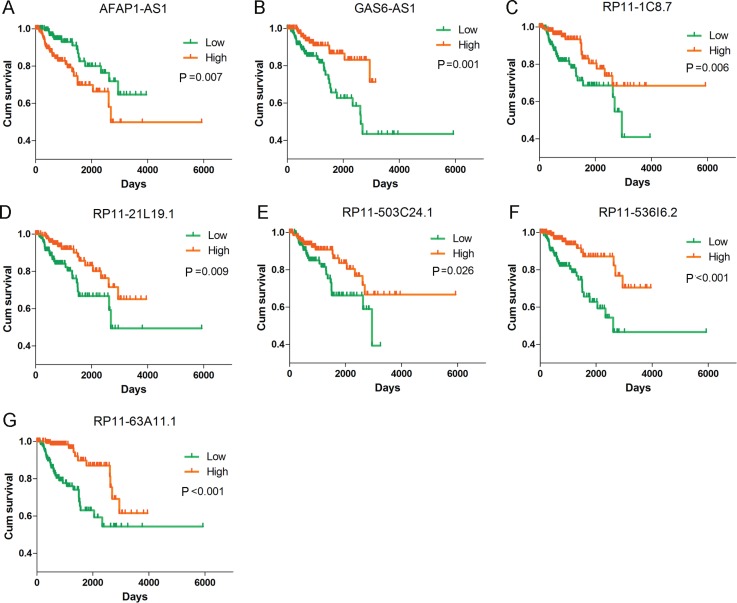
Figure 10. Kaplan–Meier curves for the seven lncRNAs signature in kidney renal papillary cell carcinoma (KIRP).
Kaplan-Meier survival curves of the seven lncRNAs showed overall survival outcomes by relative high-risk and low-risk patients. (A) AFAP1-AS1 (HR = 1.189, P < 0.001); (B) GAS6-AS1 (HR = 0.679, P < 0.001); (C) RP11-1C8.7 (HR = 0.824, P < 0.001); (D) RP11-21L19.1 (HR = 0.789, P < 0.001); (E) RP11-503C24.1 (HR = 0.848, P = 0.001); (F) RP11-536I6.2 (HR = 0.793, P < 0.001); (G) RP11-63A11.1 (HR = 0.747, P ≤ 0.001). Kaplan–Meier curves were generated by GraphPad Prism.

