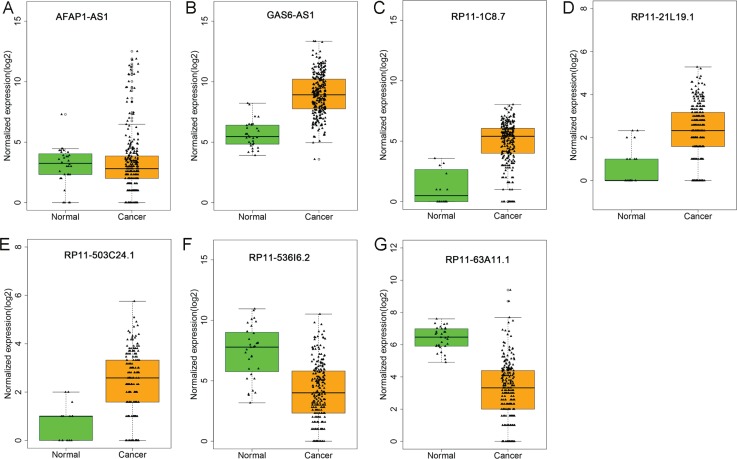
Figure 3. Different expression of the seven lncRNAs between kidney renal papillary cell carcinoma (KIRP) and normal tissues.
The boxplots were generated by R language. Statistical differences were analyzed using the two-sample t-test. Green column indicated normal tissue and dark yellow column showed KIRP tissues. (A) AFAP1-AS1; (B) GAS6-AS1; (C) RP11-1C8.7; (D) RP11-21L19.1; (E) RP11-503C24.1; (F) RP11-536I6.2; (G) RP11-63A11.1.

