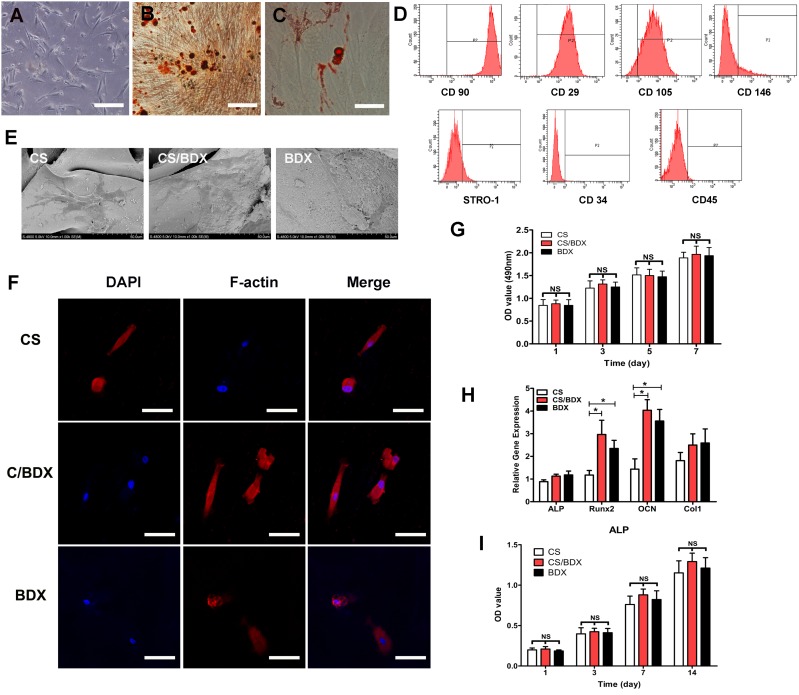
Figure 2. hJBMMSCs characterization and in vitro evaluation of hJBMMSCs on CS-based scaffolds.
(A) Morphology of hJBMMSCs at the first passage (scale bars = 50 mm). (B) Osteogenic differentiation of hJBMMSCs using Alizarin Red S staining (red color, scale bars = 50 mm). (C) Adipogenic differentiation of hJBMMSCs using Oil Red staining (red color, scale bars = 50 mm). (D) Flow cytometry profile of hJBMMSCs. (E) SEM photomicrographs of hJBMMSCs-seeded scaffolds after 3 days culture. (F) Confocal images of hJBMMSCs with dual staining of DAPI for nuclei (blue color) and phalloidin for F-actin (red color). (G) OD measurement of cell viability of hJBMMSCs on different scaffolds, cultured for 1 to 7 days. (H) Osteogenic gene expression of hJBMMSCs on different scaffolds, cultured in osteogenic induction medium at day 14. (I) OD measurement of ALP activity of hJBMMSCs on different scaffolds, cultured in osteogenic induction medium and standard medium at day 1, 3, 7, and 14. Data are shown as means ± SD with significance at *P < 0.05.

