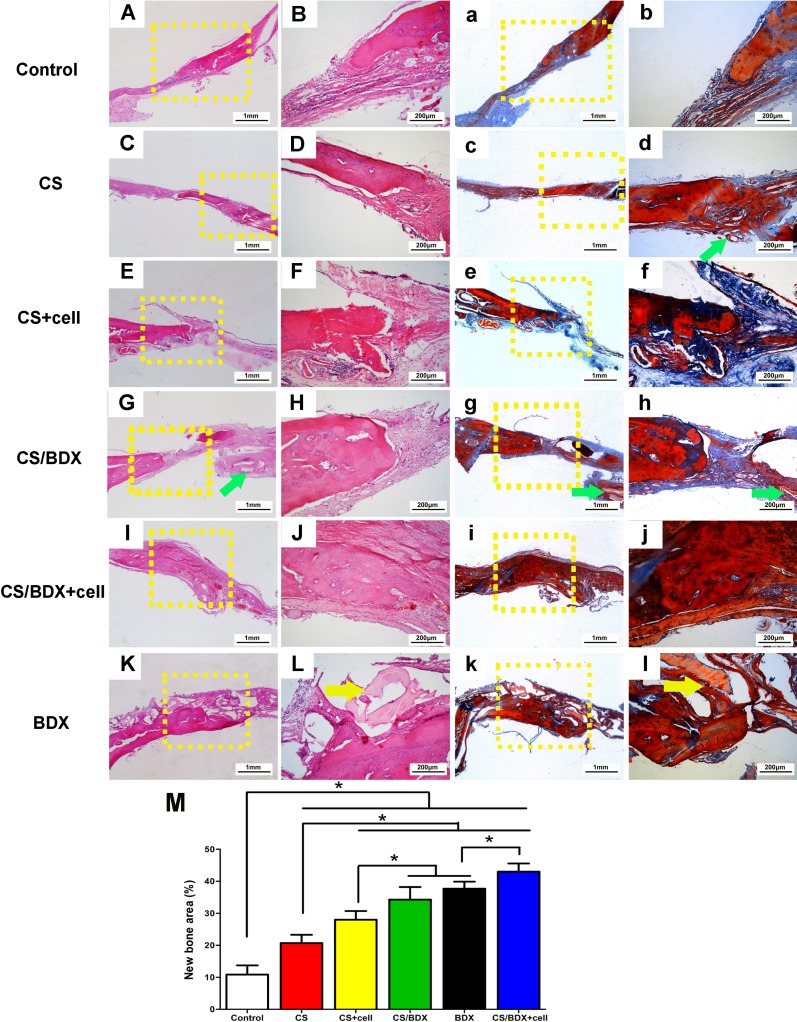
Figure 4.
Histological photomicrographs (original magnification ×25 and ×100) with hematoxylin-eosin staining (A–L) and with Masson’s trichrome staining (a–l) of critical-size circular calvarial defects 8 weeks after scaffold implantation. Green arrow shows location of residual CS and yellow arrow shows location of residual BDX. (M) Histometric analysis of new bone area of defects 8 weeks after scaffold implantation. Data are shown as means ± SD with significance at *P < 0.05.

