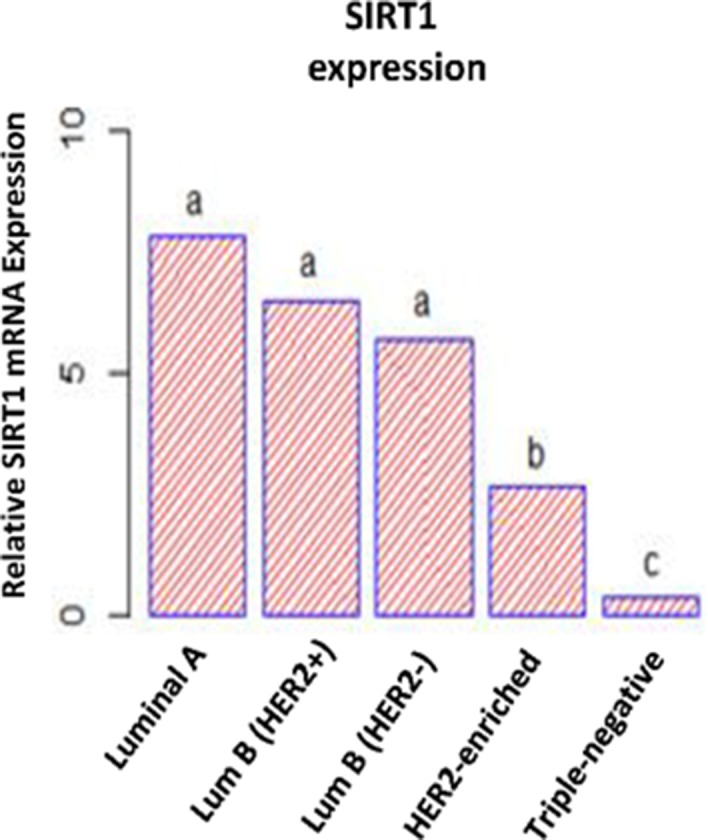
Figure 2. Differential SIRT1 mRNA expression patterns in breast tumors.

ANOVA followed by Tukey’s multiple comparison test performed on SIRT1 mRNA expression levels. This statistical analysis discerned 3 different SIRT1 expression patterns. The letters ‘a’, ‘b’ and ‘c’ indicated statistical significance between groups.
