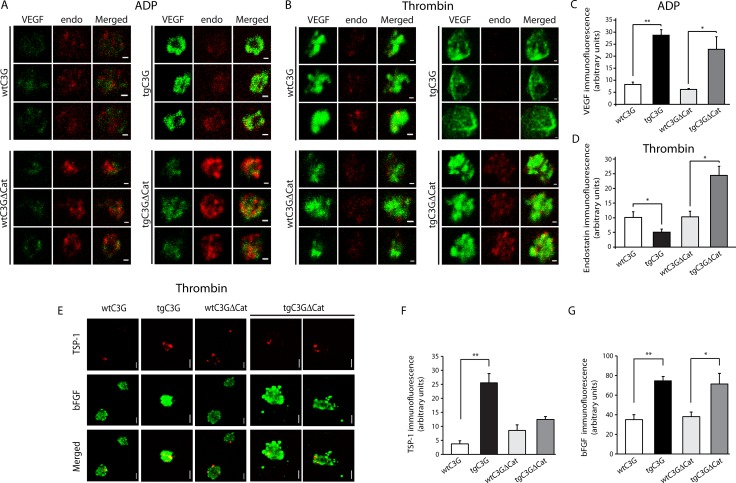
Figure 1. C3G regulates the release of VEGF, bFGF, endostatin and TSP-1 from ADP- and thrombin-stimulated platelets.
Double immunofluorescence confocal microscopy images showing the subcellular distribution of VEGF (left), endostatin (middle) and an overlay (right) in three representative ADP-activated mouse platelets (A) or thrombin-activated mouse platelets (B) from each genotype. Platelets were activated for 5 min under stirring conditions. All micrographs were taken at the same exposure time. Scale bars: 0.4 µm. The graphs show arbitrary values of immunofluorescence intensity (mean ± SEM) for VEGF (C) or endostatin (D) in the ADP- or thrombin-treated platelets respectively. (E) Representative confocal microscopy images of the subcellular distribution of TSP-1 and bFGF in thrombin-activated platelets of the indicated genotypes. All micrographs were taken at the same exposure time. Scale bars: 0.4 µm. The graphs show arbitrary values of immunofluorescence intensity (mean ± SEM) for TSP-1 (F) or bFGF (G) in each genotype. *p < 0.05; **p < 0.01.

