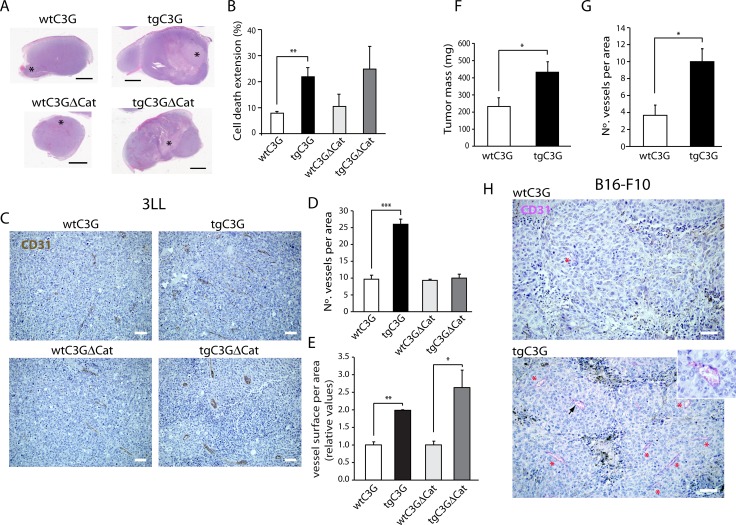
Figure 5. Platelet C3G regulates in vivo angiogenesis: Heterotopic tumors display enhanced growth in transgenic mice.
(A) Cell death extension in tumors originated by subcutaneous injection of Lewis lung carcinoma cells in wtC3G, tgC3G, wtC3GΔCat, and tgC3GΔCat mice. Representative light microscopy images of tumor slices stained with hematoxylin/eosin showing cell death area (*). (B) Quantification of cell death extension is expressed as the percentage of the total tumor area that is occupied by dead cells. The histograms represent the mean value ± SEM (n = 4 for wtC3G and tgC3G; n = 3 for wtC3GΔCat and tgC3GΔCat). Scale bars: 2.5 mm. (C) Representative images of 3LL tumor sections, from the indicated genotypes, showing vessel density by CD31 staining. Scale bars: 20 µm. Quantification of vessel number (D) and vessel size (E) in tumor sections from the indicated genotypes. 3 representative areas per tumor were analyzed. (F to H) B16-F10 melanoma tumors developed in tgC3G mice have a greater mass and are more vascularized than tumors developed in wtC3G mice. (F) Quantification of tumoral mass (n = 7 for tgC3G, n = 8 for wtC3G). (G) Quantification of vessels in 3 representative areas per tumor. All values correspond to the mean ± SEM. (H) Representative images of B16-F10 tumor sections showing immunoreactivity for CD31. Presence of vessels is indicated with asterisks. Scale bars: 20 µm. Inset, image enlargement showing a blood vessel, indicated by an arrowhead, stained for CD31 with the Chromo Map kit + Purple. *p < 0.05; **p < 0.01; ***p < 0.001.

