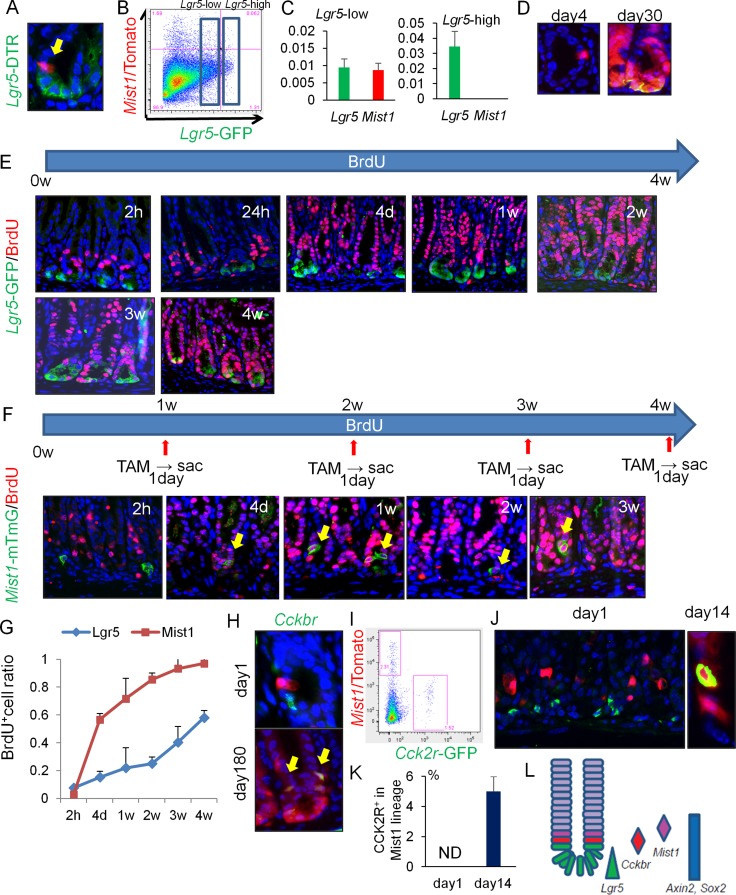
Figure 2. Mist1+ cells take up BrdU more rapidly than Lgr5+ cells.
(A) Lgr5 (green) and Mist1 (red) expression in Mist1-CreERT; Lgr5-DTR-GFP; R26-TdTomato mice 1 day after TAM induction. (B) FACS plot of Mist1-CreERT; Lgr5-DTR-GFP; R26-TdTomato mice antrum 1 day after TAM induction. Boxes indicate Lgr5-low and Lgr5-high expressing cell populations. (C) Relative mRNA expression/Gapdh of Lgr5 and Mist1 in Lgr5-high cells and Lgr5-low cells from the Mist1-CreERT; Lgr5-DTR-GFP; R26-TdTomato mice antrum 1 day after TAM induction. N.D. means “not detected”. N = 3. (D) Lineage tracing of DT-treated (day4 and day30 after tamoxifen induction) Mist1-CreERT; Lgr5-DTR-GFP; R26-TdTomato mice. DT was given at 1 day after tamoxifen. (E) Immunofluorescence of GFP (green) and BrdU (red) in Lgr5-EGFP-IRES-CreERT mice given BrdU continuously by drinking water (1.0 mg/ml). Mice were sacrificed at indicated time points. (F) Immunofluorescence of GFP (green) and BrdU (red) in Mist1-CreERT; R26-mTmG mice given BrdU continuously by drinking water. Mice were sacrificed at the indicated time points (1 day after TAM induction). (G) BrdU+ cell ratio of Lgr5+ cells and Mist1+ cells. A total of 300 cells from three mice were analyzed at each time point. (H) Antral images of Mist1-CreERT; R26-TdTomato mice crossed to Cckbr-EGFP mice 1 and 180 days after TAM induction. Arrows indicate Tomato and EGFP double-positive cells. (I) FACS plot of Mist1-CreERT; R26-TdTomato; Cckbr-EGFP mice 1 day after tamoxifen. (J–K) Immunofluorescence images showing CCK2R staining (green) in Mist1-CreERT; R26-TdTomato mice 1 day and 14 days after TAM induction. CCK2R+ cells/Mist1+ cells are quantified in (K). A total of 300 cells from three mice were analyzed. (L) Schematic model of antral stem/progenitor cells.

