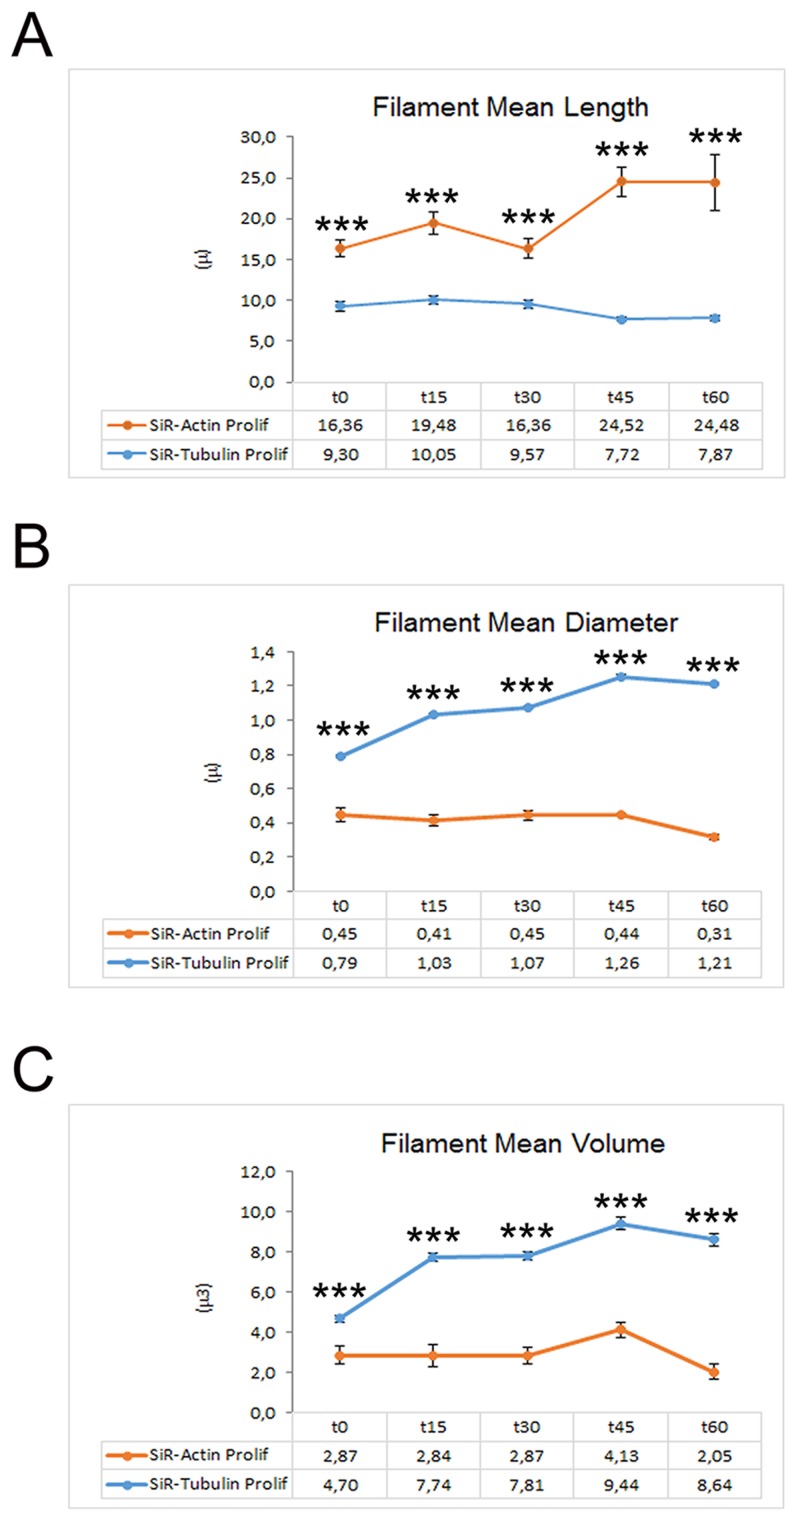
Figure 3. Graphs depicting the quantitative data of actin and tubulin dynamics in proliferating iPSCs obtained by Imaris - Filament analysis module.
Graphs showing the Filament Mean Length (A), the Filament Mean Diameter (B) and the Filament Mean Volume (C). Significant differences were indicated by asterisks (*: p< 0,05; **:< 0,01; ***: p< 0,001).

