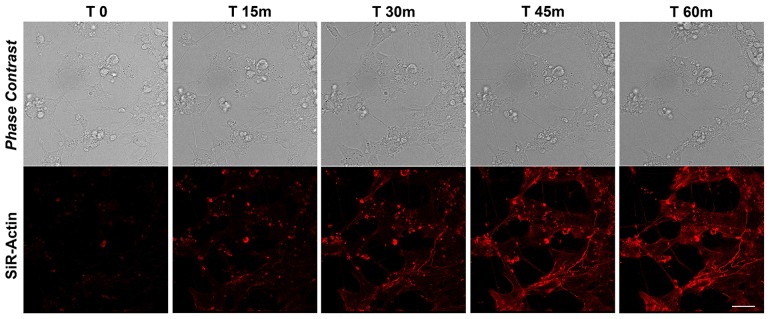
Figure 4. SiR-Actin in differentiated iPSCs.
Live-cell imaging of SiR-Actin probe in iPSCs-derived neurons. Confocal microscopy images with their corresponding bright field photographs following 60 minutes from de-polymerization of the actin filaments with cytochalasin D stained with the live marker SiR-Actin (red). Bar: 30 μm.

