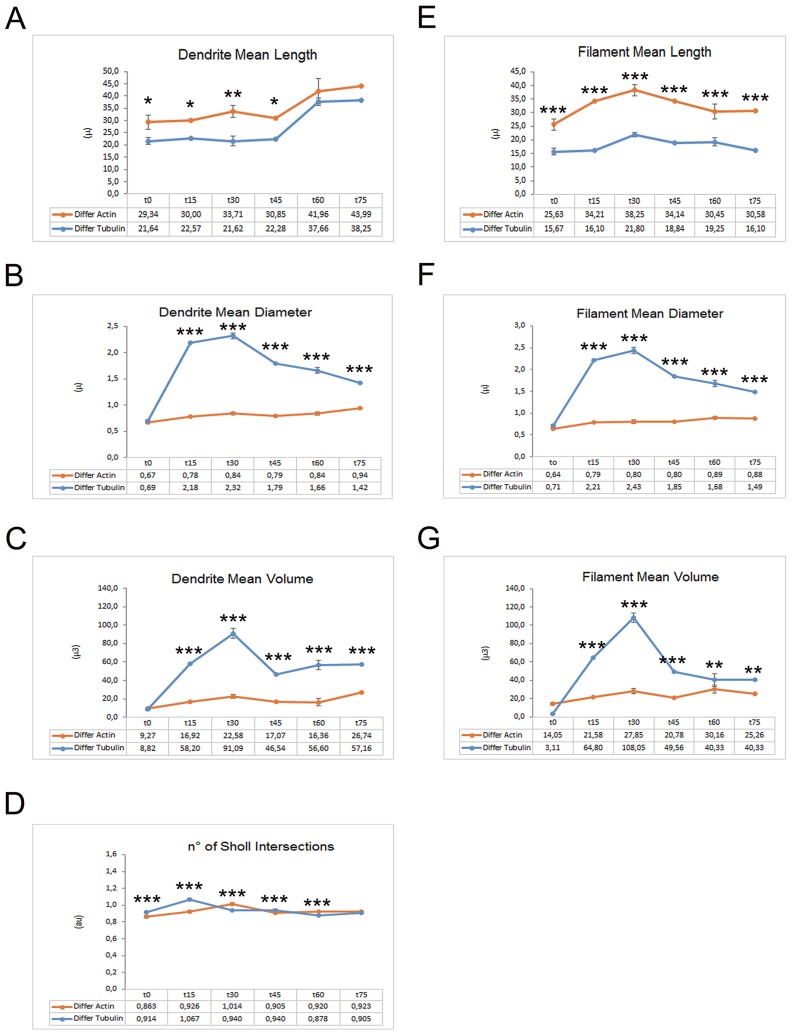
Figure 7. Graphs reporting quantitative data of actin and tubulin dynamics in iPSC-derived neurons obtained by Imaris - Filament analysis module.
Graphs showing the Dendrite Mean Length (A), the Dendrite Mean Diameter (B), the Dendrite Mean Volume (C), the no. of Sholl Intersections (D), the Filament Mean Length (E), the Filament Mean Diameter (F) and the Filament Mean Volume (G). Significant differences were indicated by asterisks (*: p< 0,05; **:< 0,01; ***: p< 0,001).

