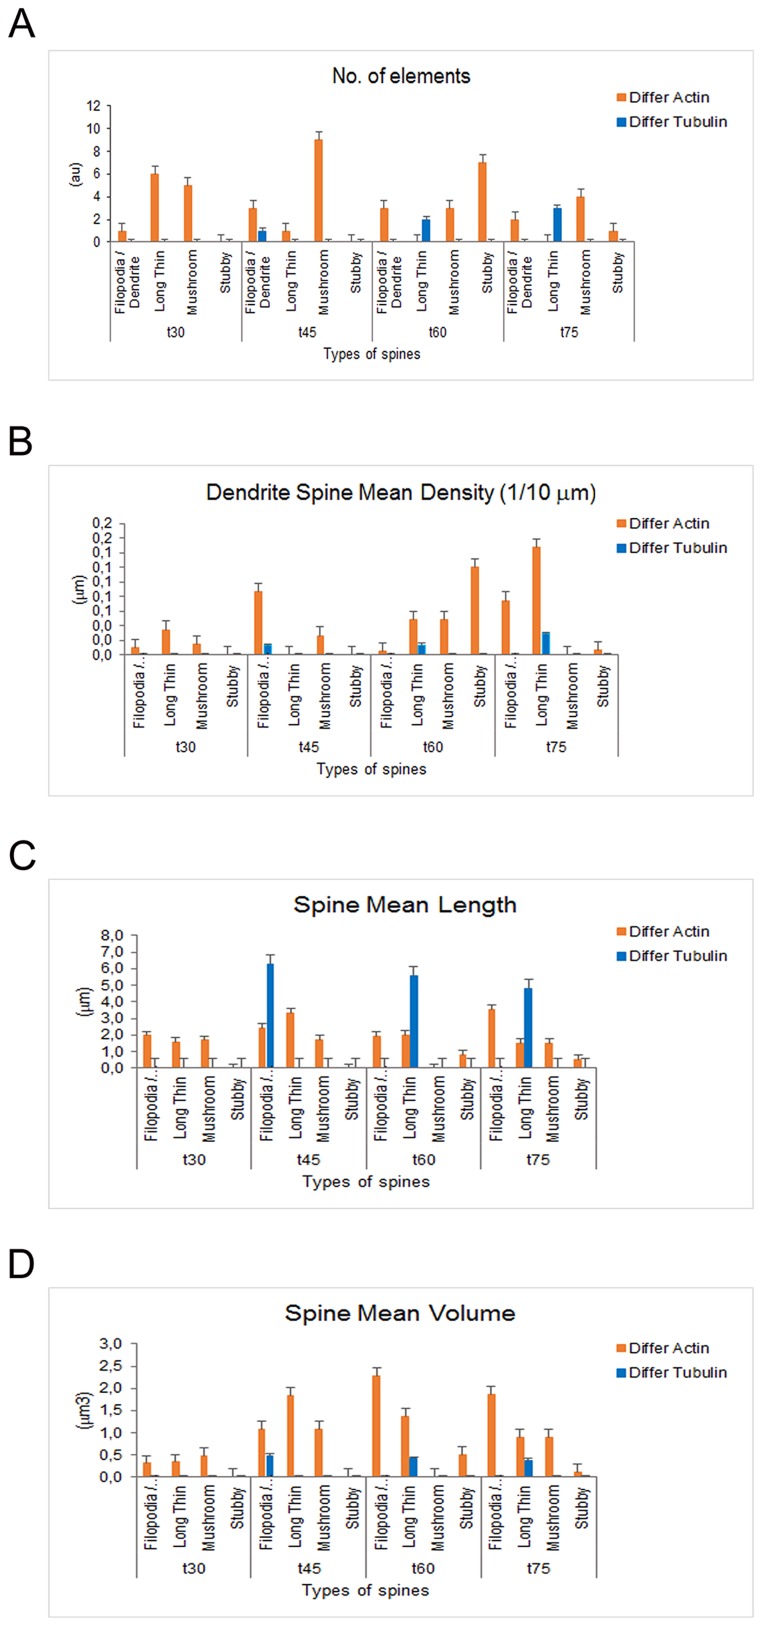
Figure 8. Dendritic spine measurements in iPSCs-derived neurons following actin and tubulin dynamics obtained by Imaris - Filament analysis module.
Graphs showing the no. of elements (A), the no. of elements (A), the Dendritic Spine Density (B), the Spine Mean Length (C) and the Spine Mean Volume (D) in iPSC-derived neurons.

