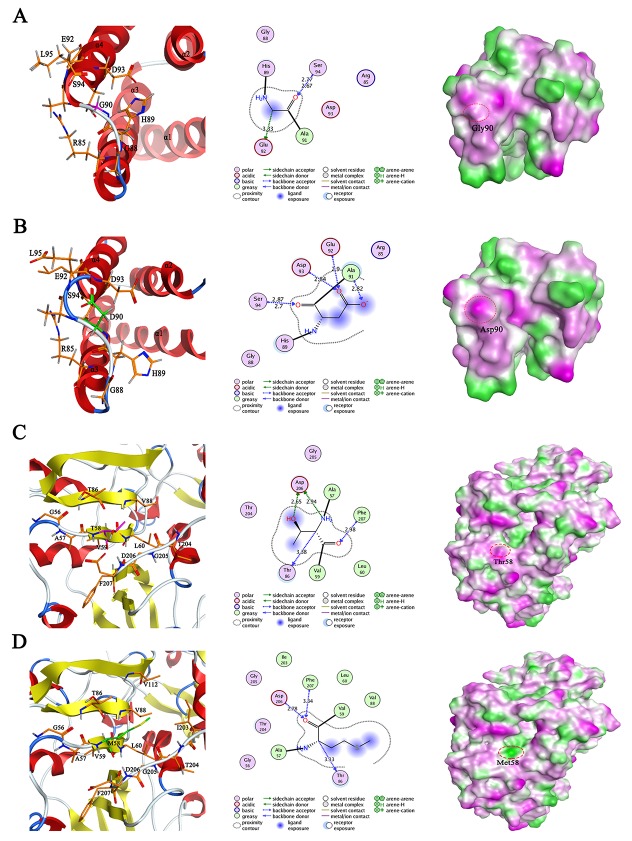
Figure 2.
The modeled 3D structure comparison of human wild type SAA1 (A) and its mutant G90D (B), as well as wild type SCOT1 (C) and its mutant T58M (D). Left panel: the ribbon secondary structure diagram with α helices in red and β sheets in yellow; middle panel: the proposed interactions between mutated residue and its surrounding residues, distances are not represented to scale; right panel: the lipophilic surface representation by showing hydrophilic (magenta), neutral (green) and lipophilic (white).

