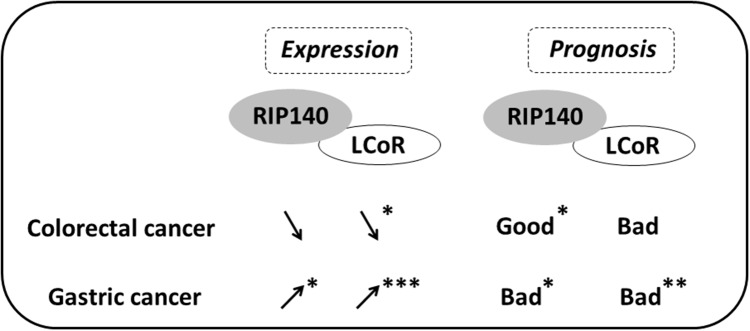
Figure 6. Scheme comparing the expression and prognosis value of RIP140 and LCoR in CRC and GC.
The variations of RIP140 and LCoR expression in tumoral tissue as compared to normal mucosa are shown by arrows for CRC and GC. The prognostic value (bad or good) of RIP140 and LCoR expression is also shown. Significant correlations are marked with asterisks (*=p≤0.05, **=p≤0.01, ***=p≤0.001).

