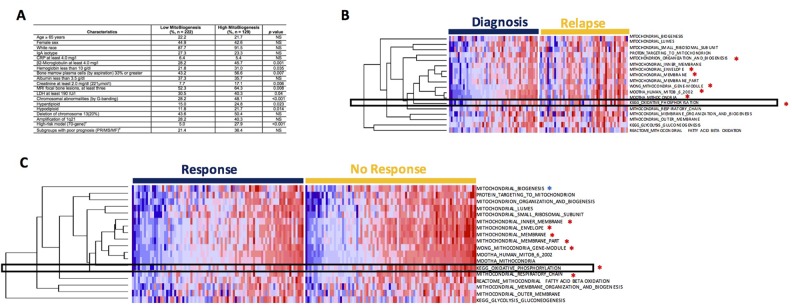
Figure 3. Drug resistant myeloma patients show higher expression of MitoBio gene sets.
(A) Univeriate analysis was used to analyze the correlation of MitoBio score and clinical characteristics in TT2. (B) Single–sample gene set enrichment analysis performed in 51 paired GEPs collected at diagnosis and at relapse from 51 MM patients enrolled in the TT2 cohort. Seven of the 18 sets show significantly upregulation (*). Samples were pre-ordered based on the Total-ssGSEA scores in diagnosis group. (C) Correlation of MitoBio genes with drug resistance in the APEX trial including 264 relapsed MM samples and 169 patients were treated with bortezomib. The MitoBio signature, oxidative phosphorylation and 6 other mitochondrial datasets (*p<0.05) are increased in bortezomib-resistant MM samples (right) compared to bortezomib-sensitive MM samples (left). Samples were pre-ordered based on the Total-ssGSEA scores in each group.

