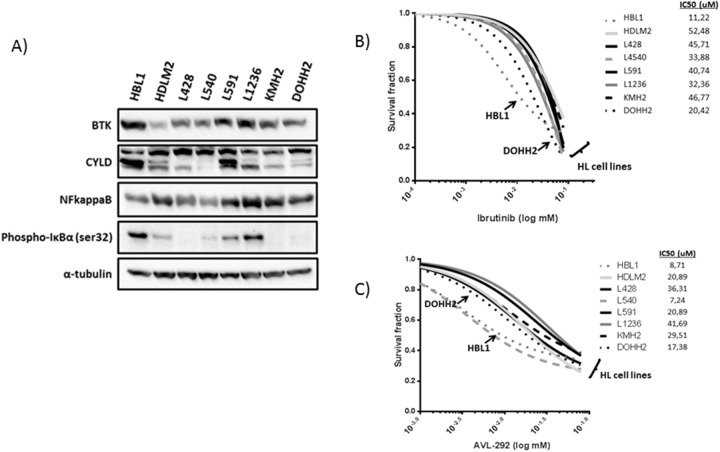
Figure 3. Functional studies in cHL-derived and DLBCL-derived cell lines.
(A) Western blot analysis of total BTK, CYLD truncation, NFKB (p52 isoform), and phospho-IkBα. (B and C) Activity of BTK selective inhibitors in cHL-derived and DLBCL-derived cell lines. IC50 range calculation of HBL1, HDLM2, L540, and L1236 cell lines in the presence of different concentrations of Ibrutinib or AVL-292, after 48 hours.

