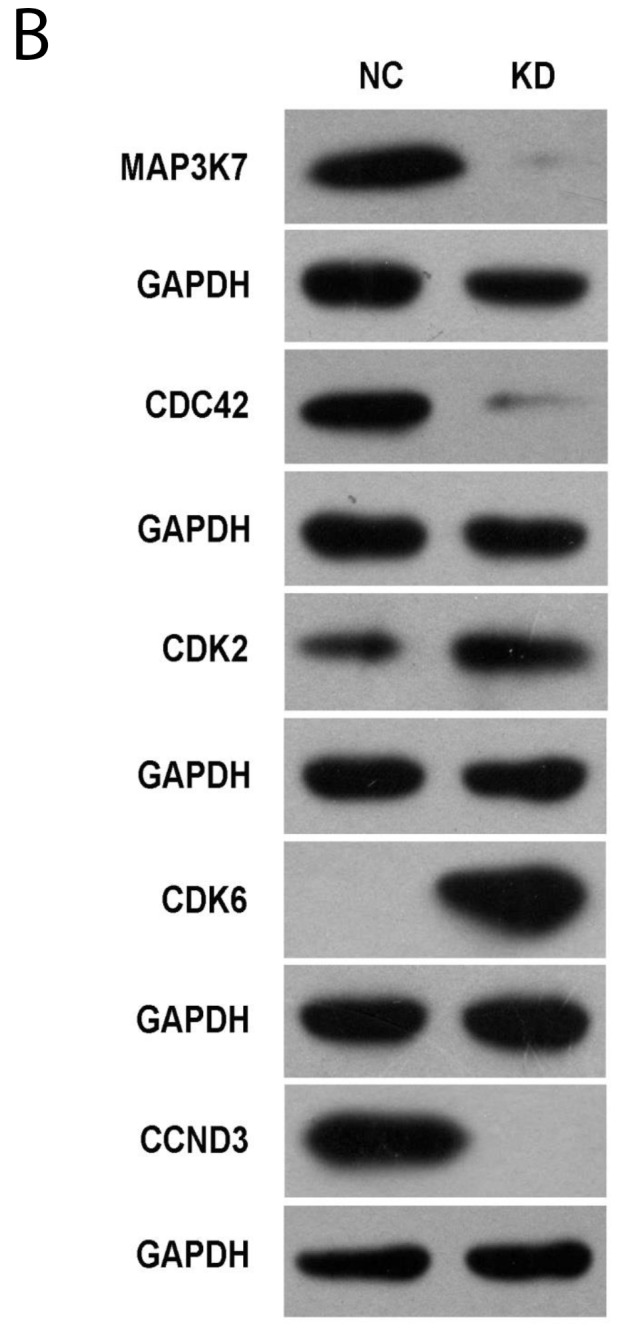
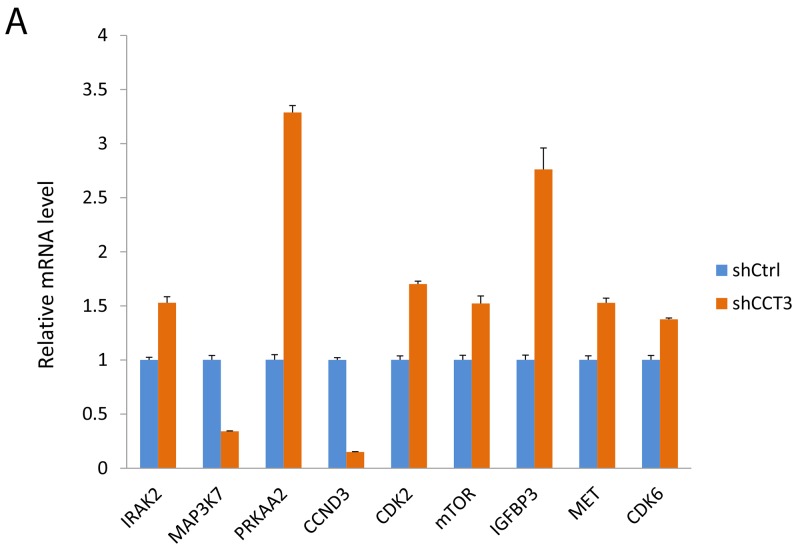
Figure 5. Gene expression affected by CCT3 knockdown.

(A) Expression of selected genes changed after knockdown of CCT3 in MGC-803 cells. qPCR showed upregulation of IRAK2, PRKAA2, CDK2, mTOR, IGFBP3, MET, CDK6 and downregulation of MAP3K7, CCND3 in CCT3 knockdown cancer cells. (t test, P<0.01 for all genes). (B) Western blotting showed increased levels of MAP3K7, CDC42, CCDN3 and decreased levels of CDK2 and CDK6 in the MGC-803 cells after CCT3 knockdown.

