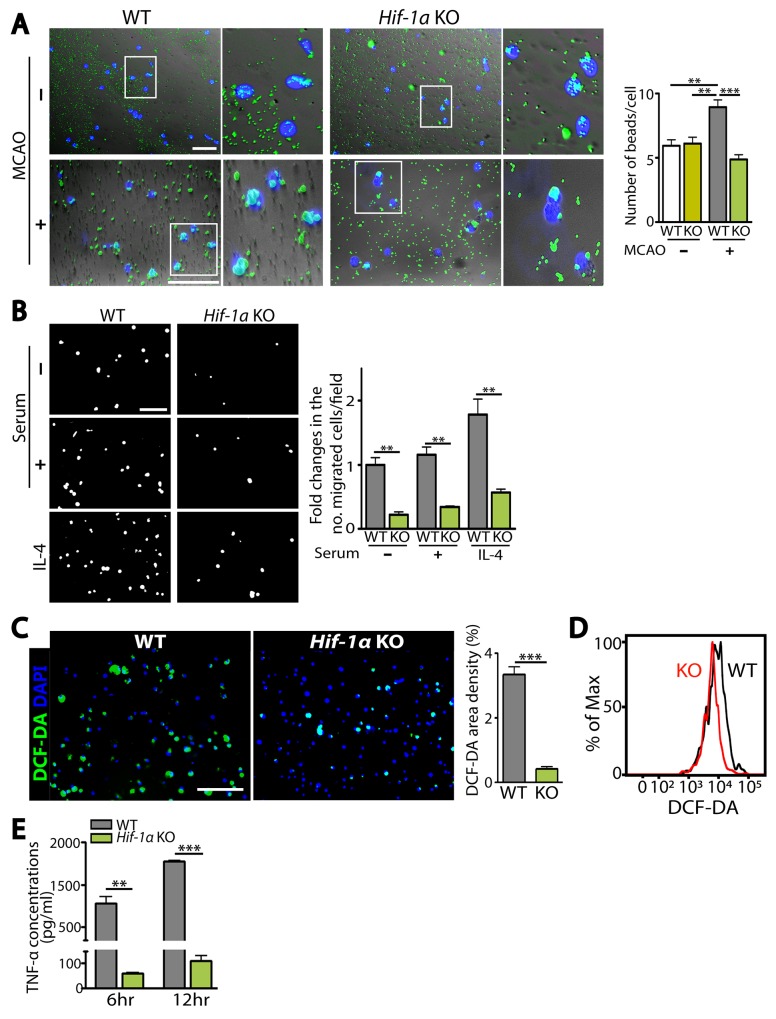
Figure 6. HIF-1α-deficient microglia are impaired in microglial functions including phagocytosis, chemotaxis, and production of ROS and TNF-α.
(A) Representative images (left) and quantification (right) of phagocytic uptake of fluorescent beads in microglia isolated from WT or Hif-1α KO mice at d5 post-MCAO. White boxes are magnified and shown on the right. (B) Representative images of transmigrated microglia, prepared as in A towards the lower compartment of modified Boyden chamber containing media supplemented with no serum, 10% serum, or IL-4. Quantification of the number of migrated microglia per field is shown in the bar graph. (C) Representative images of microglia prepared as in A incubated with DCF-DA. Quantification of FITC-positive area densities are shown in the bar graph. Nuclei in A and C are counterstained with DAPI (blue). Scale bars in A, B, and C indicate 100 μm. (D) Histogram analyses by FACS for DCF-DA fluorescence intensity in microglia from WT (black) or Hif-1α KO (red) mice, as prepared in A. (E) ELISA measurements of TNF-α concentrations at 6 and 12 hr in the supernatant obtained from microglia isolated as in A. Numbers in the bar graphs of A, B, C, and E are the mean ± s.e.m. with ** and *** indicate P < 0.01 and < 0.001, respectively.

