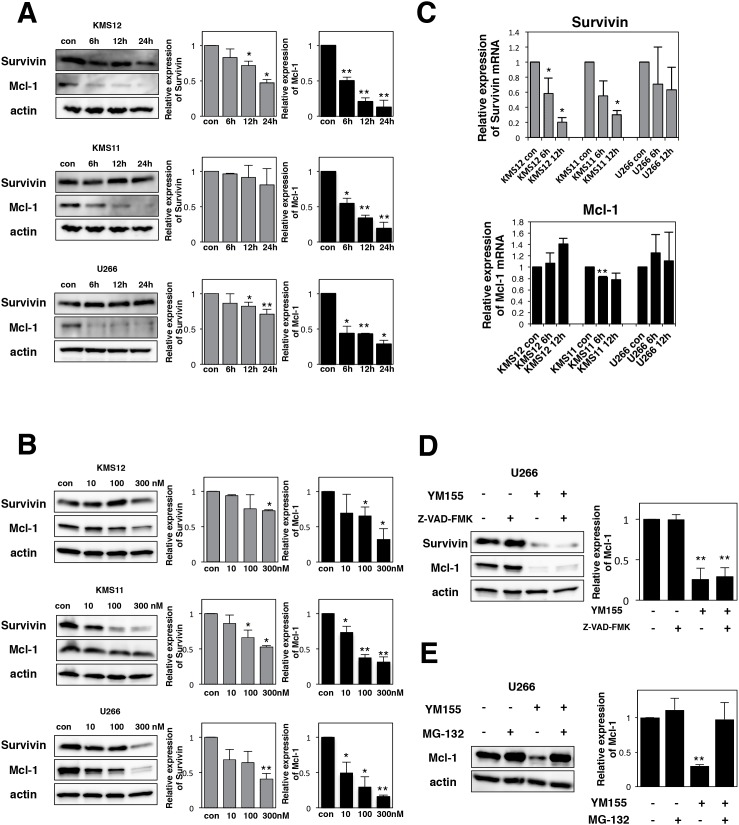
Figure 2. YM155 suppresses the expression of survivin and Mcl-1 protein.
(A) The cells (KMS12, KMS11, and U266) were treated with 0.1 μM YM155 for indicated time periods (control: 0.1% DMSO). (B) The cells were treated with 10, 100, or 300 nM YM155 for 24 hr. Expression levels of survivin and Mcl-1 protein were analyzed by immunoblotting (left panel) as described in Materials and Methods. Histograms (right panels) represent the ratio of band intensity of drug-treated to vehicle-treated, each normalized to background. Error bars represent SD from triplicate experiments. (C) Expression levels of survivin and Mcl-1 mRNA were analyzed by real-time RT-PCR analysis using 18s rRNA as an internal control. The cells (KMS12, KMS11, and U266) were treated with 1 μM YM155 for indicated time periods (control: 0.1% DMSO). After drug treatment, total RNA was prepared. Colums, mean from three separate experiments. *P<0.05, **P<0.01. (D) The U266 cells were incubated with 0.1 μM YM155 in the presence or absence of 30 μM Z-VAD-FMK for 24 hr. Z-VAD-FMK was added 60 min before addition of YM155. Survivin and Mcl-1 protein expression was analyzed by immunoblotting (left panel). Histograms (right panels) represent the ratio of band intensity of drug-treated to vehicle-treated, each normalized to background. Error bars represent SD from triplicate experiments. (E) The U266 cells were incubated with 0.1 μM YM155 or 20μM MG-132, alone or in combinations for 6 hours. MG-132 was added 60 min before addition of YM155. Mcl-1 protein expression was analyzed by immunoblotting (left panel). Histograms (right panels) represent the ratio of band intensity of drug-treated to vehicle-treated, each normalized to background. Error bars represent SD from triplicate experiments. **P<0.01.

