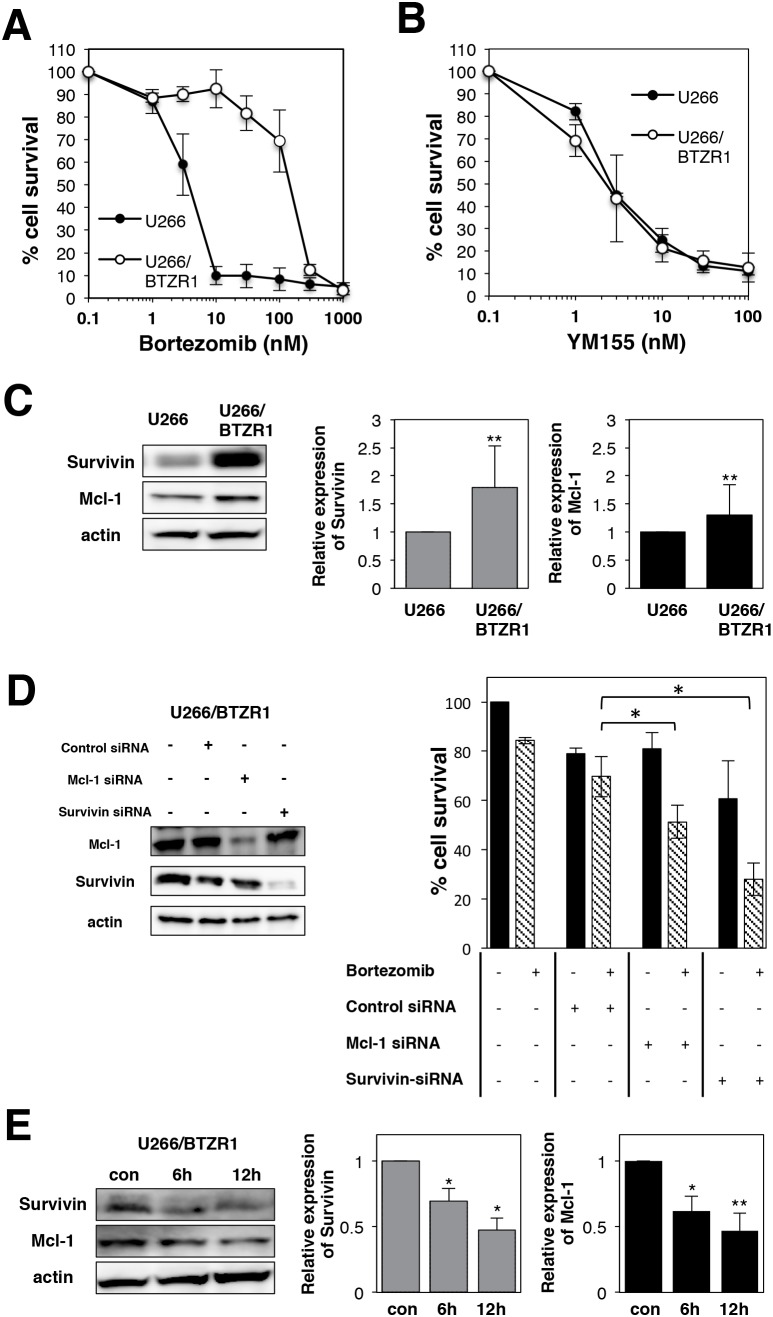
Figure 8. YM155 overcomes bortezomib resistance in MM cells.
(A) Cell growth inhibition by bortezomib in U266 or U266/BTZR1 cells. (B) Cell growth inhibition by YM155 in U266 or U266/BTZR1 cells. The cells were incubated with various concentrations of bortezomib (A) or YM155 (B) at 37°c for 72 h. Cell growth inhibition rate was determined by Cell counting Kit as described in Materials and Methods. IC50 was calculated as the mean of three independent experiments with triplicate determinations at each concentration. (C) Expression levels of survivin and Mcl-1 protein in U266 or U266/BTZR1 cells were analyzed by immunoblotting (left panel). Histograms (right panels) represent the ratio of band intensity compared to its parental cells, each normalized to background and band intensity of actin. Error bars represent standard deviation (SD, n ≥ 3). (D) U266/BTZR1 cells were transfected with siRNA against survivin or Mcl-1 by electroporation. Cells were also transfected with control siRNA. Proteins were extracted from the transfected cells 24 h after electroporation. Expression levels of survivin and Mcl-1 protein were analyzed by immunoblotting as described in Materials and Methods (left panel). Twenty-four hours after electroporation, U266 cells were incubated with 30 nM bortezomib for 72 h. The cell growth was determined by trypan blue dye exclusion assay. All quantitative data are shown as the mean of three independent experiments. Error bars represent SD from triplicate experiments (right panel). (E) Expression levels of survivin and Mcl-1 protein were analyzed in U266/BTZR1 cells incubated with YM155 by immunoblotting (left panel). The U266/BTZR1 cells were treated with 0.1 μM YM155 for indicated time periods (control: 0.1% DMSO). Histograms (right panels) represent the ratio of band intensity of drug-treated to vehicle-treated, each normalized to background. Error bars represent standard deviation (SD, n ≥ 3).

