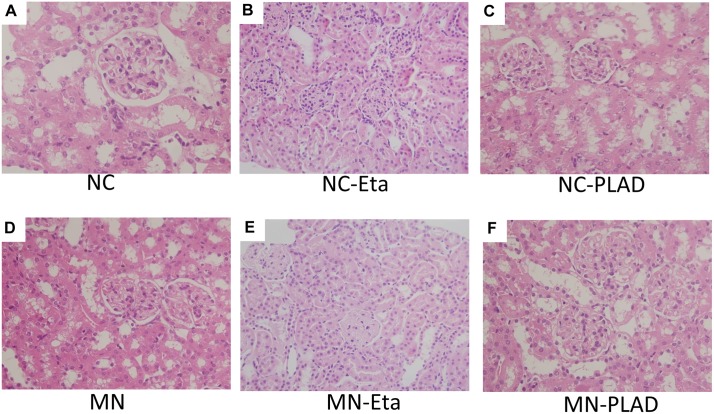
Figure 2. Changes in renal histopathology in mice with experimental MN as shown by H&E staining.
Mice in the NC group (A–C) and MN group (D–F) were treated with PBS (A and D), etanercept (MN-Eta; B and E), or preligand assembly domain fusion protein (MN-PLAD; C and F) and the tissues were stained with H&E. All images are at 400× magnification.

