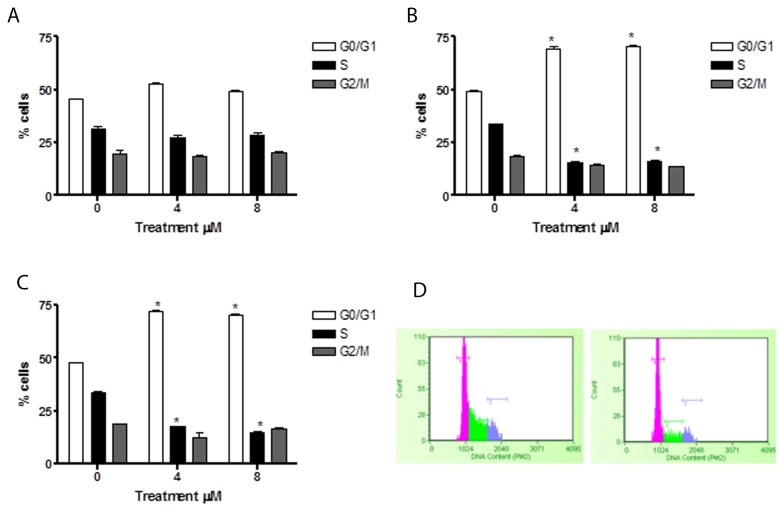
Figure 7. Effect of 6-MITC on cell cycle progression of HL-60 cells.
Fraction of HL-60 cells in the different phases of the cell cycle after 24h (A), 48h (B), 72h (C) and representative histograms of cell cycle analysis at 72h treatment at 0μM (left) and 8μM (right) (D). Cellular distribution in the different phases was evaluated by FCM as described in Methods. Each bar represents the mean ± SEM of five independent experiments. Data were analysed using repeated ANOVA followed by Bonferroni post-test. *p<0.05 vs control.

