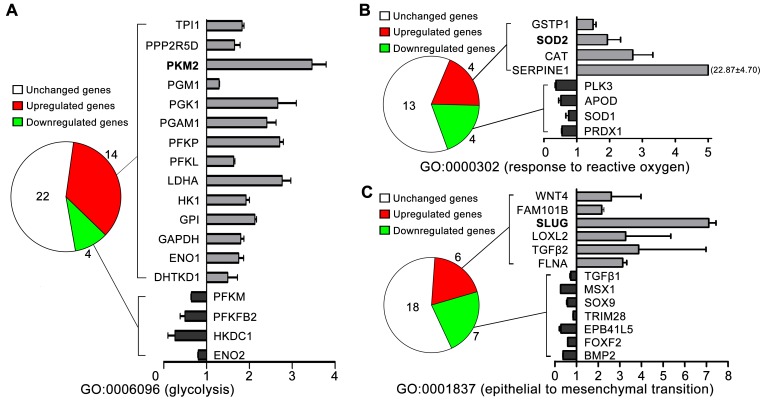
Figure 2. The gene expression patterns of TSCC cells cultured with normal glucose (5.6mM) and high glucose (16.7mM) determined by microarray analysis.
(A) 14/40 of the glycolytic related gene (GO0006096, glycolysis) were upregulated in TSCC cells cultured in 16.7mM glucose compared with those TSCC cells cultured in 5.6mM glucose, including PKM2. The expression of SOD2 [GO0000302, response to reactive oxygen species (B)], Slug [GO0001837, epithelial to mesenchymal transition (C)] were also found to be upregulated in 16.7mM glucose cultured TSCC cells than in 5.6mM glucose cultured TSCC cells.

