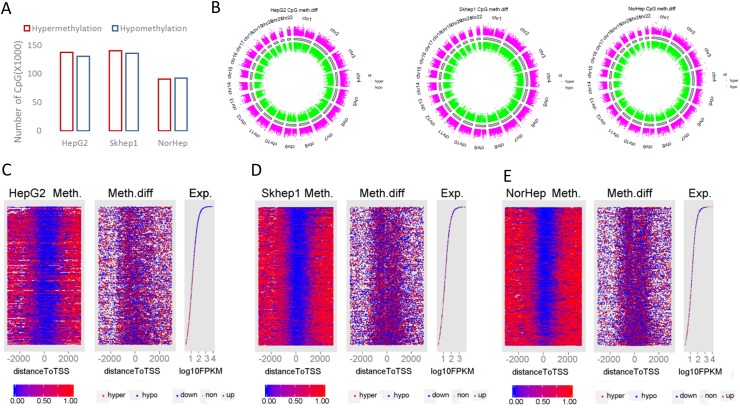
Figure 3. Genome wide response of the methylome to SAM treatment.
(A) Chart depicting the number of differentially methylated CpGs derived from capture bisulfite sequencing analysis computed by MethylKit package (q value<=0.05, %methylation difference >=15%). (B) Circular representation of the differentially methylated CpGs in all chromosomes (red: hypermethylation; green: hypomethylation relative to controls). (C-E) HepG2 (C), SKhep1 (D) and NorHep (E) cell lines. Left panels are heatmaps visualizing methylation levels of CpGs at TSS and flanking regions (±3kb) for all genes in untreated cells lined by the rank order of gene expression from high at top to low at the bottom, the profile of gene expression level for the corresponding genes is at the right; genes that were downregulated by SAM are represented in blue dots and genes upregulated by SAM are represented with red dots. The middle panel visualizes differentially methylated CGs after SAM treatment at TSS and flanking regions lined up by the same order as the right and left panels. Methylation level scales from 0% (blue) to 100% (red) are presented in the lower panel.

