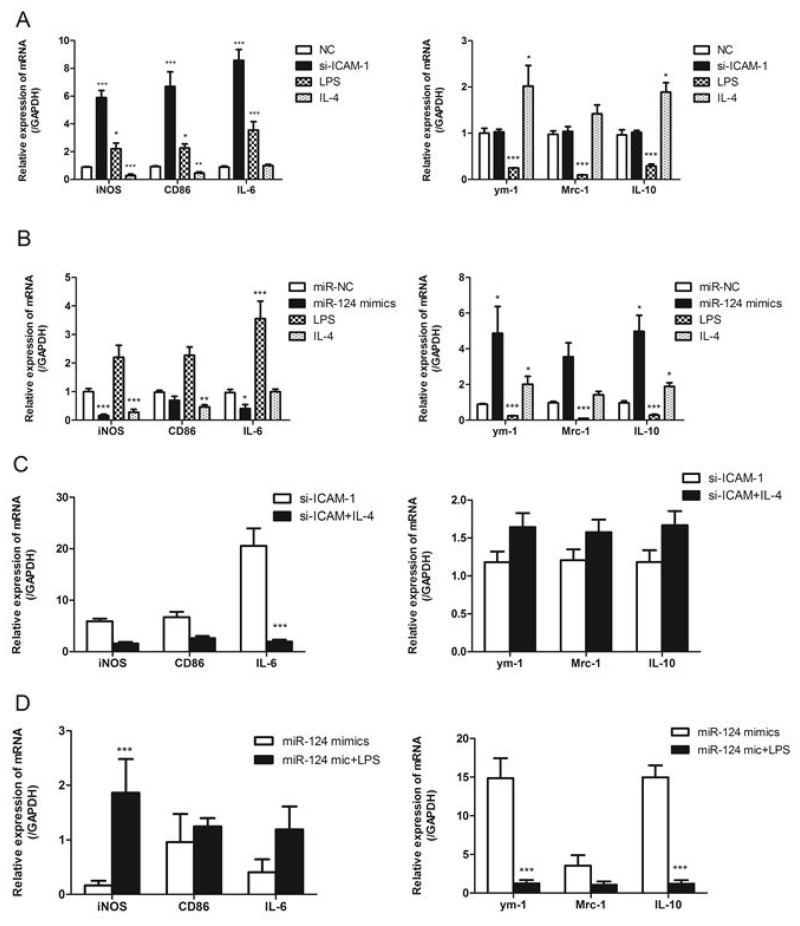
Figure 6. ICAM-1 and miR-124 induce different macrophage polarizations.
(A) Real-time qPCR analysis of the mRNA expression of M1 marker (iNOS, CD86, IL-6) and M2 (ym-1, Mrc-1, IL-10) markers in ICAM-1 siRNA or negative control transfected with RAW264.7 cells. RAW264.7 cells treated with for 24h. (B) RAW264.7 cells were transfected with miR-124 mimics or negative control, LPS (2ug/ml) or IL-4 (20ng/ml), mRNA expressions of M1 and M2 markers were analyzed with real-time qPCR. (C) The mRNA expressions of M1 and M2 markers in RAW264.7 cells transfected with siRNA-ICAM-1 for 24h in the presence or absence of IL-4. (D) The mRNA expressions of M1 and M2 markers in RAW264.7 cells transfected with miR-124 mimics for 24h in the presence or absence of LPS. (* p < 0.05, ** p <0.01, *** p <0.001).

