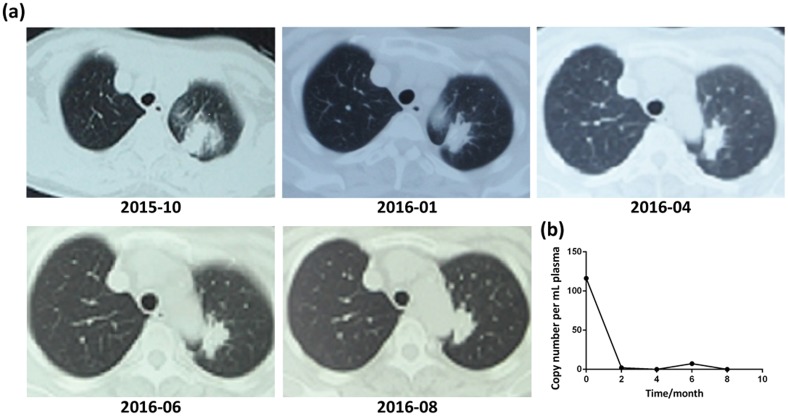
Figure 4. Correlation between radiological responses and the concentration of EGFR mutant alleles in plasma: a case report of a T+P+ patient.
(a) Serial CT images of the patient. The diagnosis was made at 2015-10 and responses to gefitinib were evaluated every two months thereafter. (b) Longitudinal monitoring of plasma EGFR 19del concentration using ARMS-Plus.

