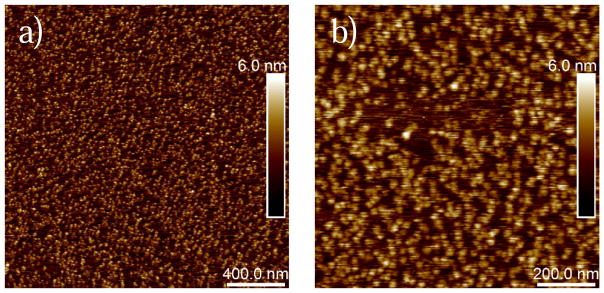
Figure 2.
AFM topography images of G-actin immobilized on mica in G-buffer. a) A 2×2 μm2 topography image showing almost a full surface coverage with G-actin. b) A 1×1 μm2 topography image of G-actin showing surface details of globular actin. Note that the dense but uniform surface coverage provided chances for relatively frequent measurements of specific unbinding events in the force-distance curves.

